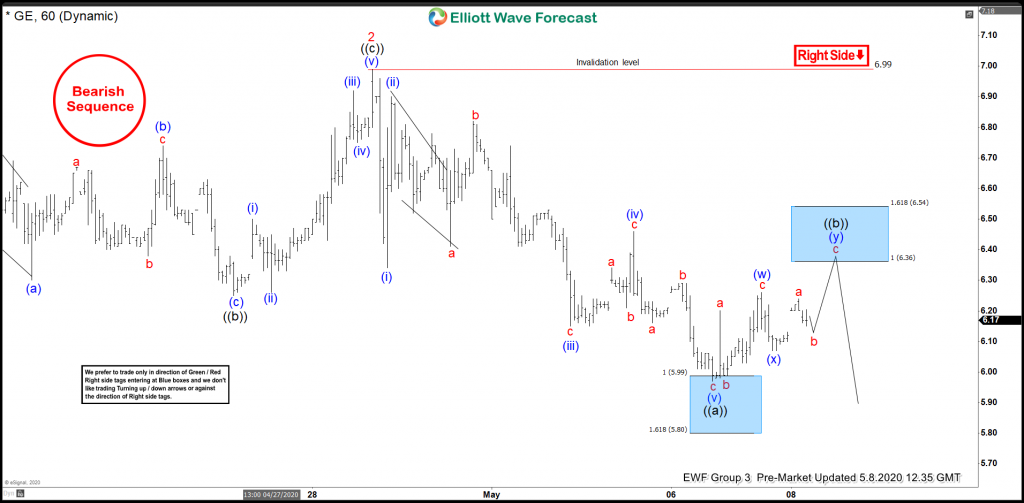
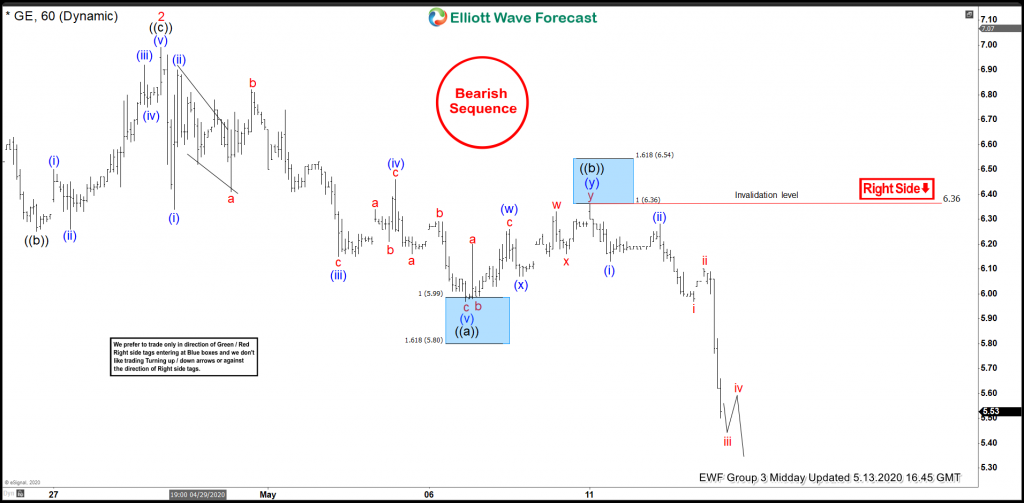
In this technical blog, we are going to take a look at the past performance of GE 1-Hour Elliott wave Charts. That we presented to our members. In which, the decline from the 3/26/2020 peak is taking place as an ending diagonal structure in higher degree wave (5) with the sub-division of 3-3-3-3-3 structure in each lower. Also, the decline from that peak showed a lower sequence with a bearish sequence stamp called for more downside to take place. Therefore, our members knew that the sequence is incomplete. And selling the intraday bounce in 3 or 7 swings into the direction of the right side tag remained the preferred path. We will explain the Elliott wave structure & selling opportunity our members took below.
GE 1 Hour Elliott Wave Chart

GE 1 Hour Elliott Wave Chart from 5/08/2020 Pre-Market update. In which, the bounce to $6.99 high ended wave 2 of a diagonal. Down from there, the decline in red wave 3 unfolded as a zigzag structure. Whereas wave ((a)) ended at $5.97 low. Wave ((b)) bounce was expected to find sellers at the blue box area at $6.36- $6.54 100%-161.8% Fibonacci extension area of (w)-(x). From there, the stock was expected to see sellers looking for the next extension lower or for 3 wave reaction lower at least.
GE 1 Hour Elliott Wave Chart

Here’s the 1 Hour Chart of GE from 5/13/2020 Midday update. Showing the reaction lower taking place from the blue box area at $6.36- $6.54. As we can clearly see that the stock was able to make new lows. Allowed members to create a risk-free position shortly after taking the short trade.
