USDJPY Technical Analysis
On April 8/2020 I posted on social media (Stocktwits/Twitter) @AidanFX “USDJPY Break below 108.60 can push the pair lower towards 108 area”
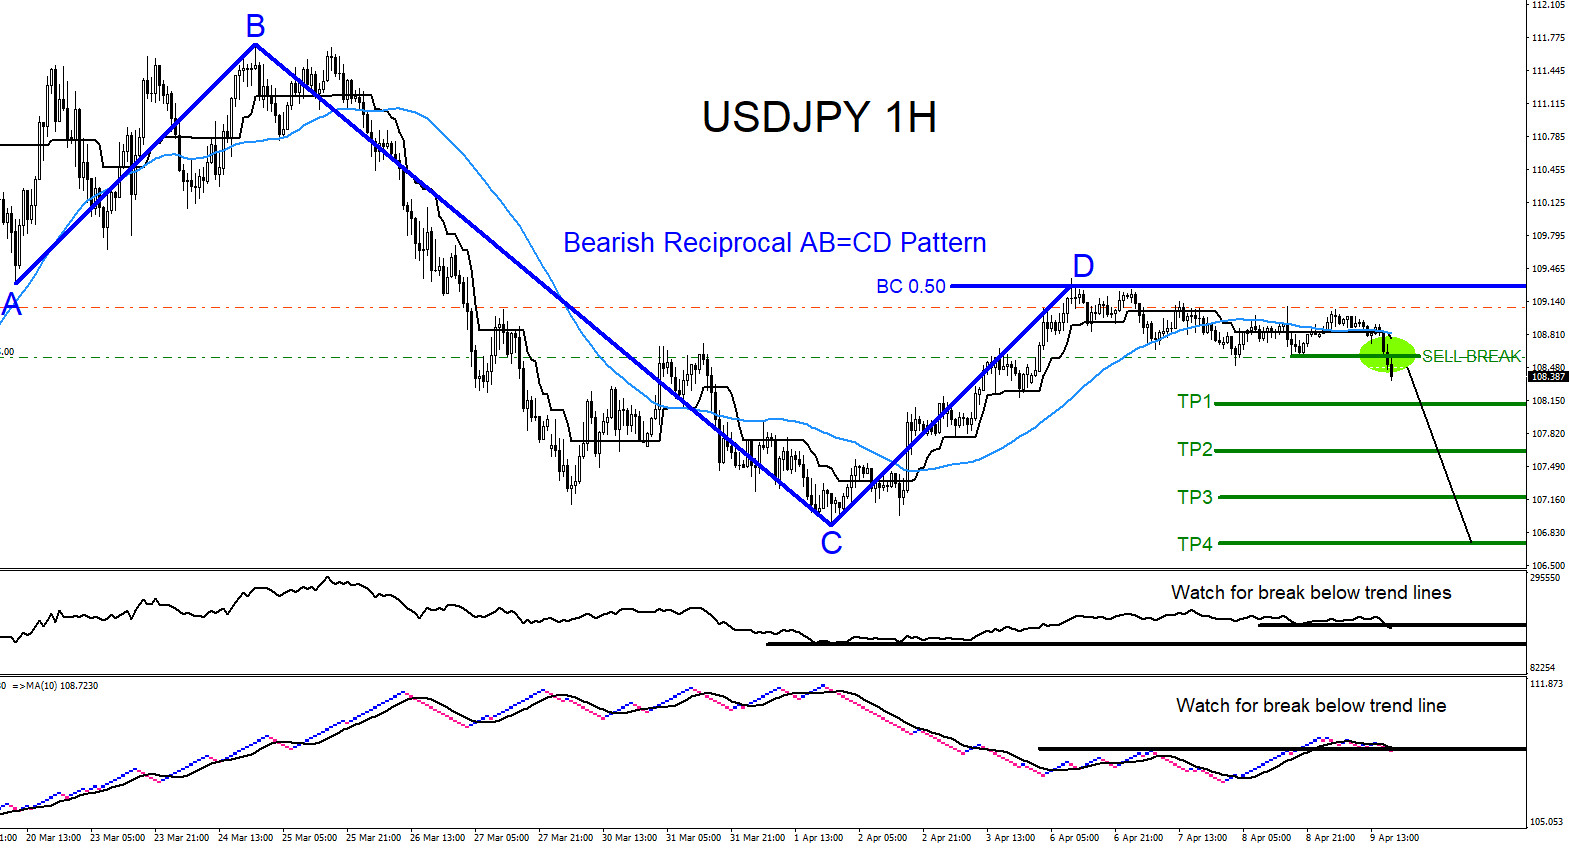
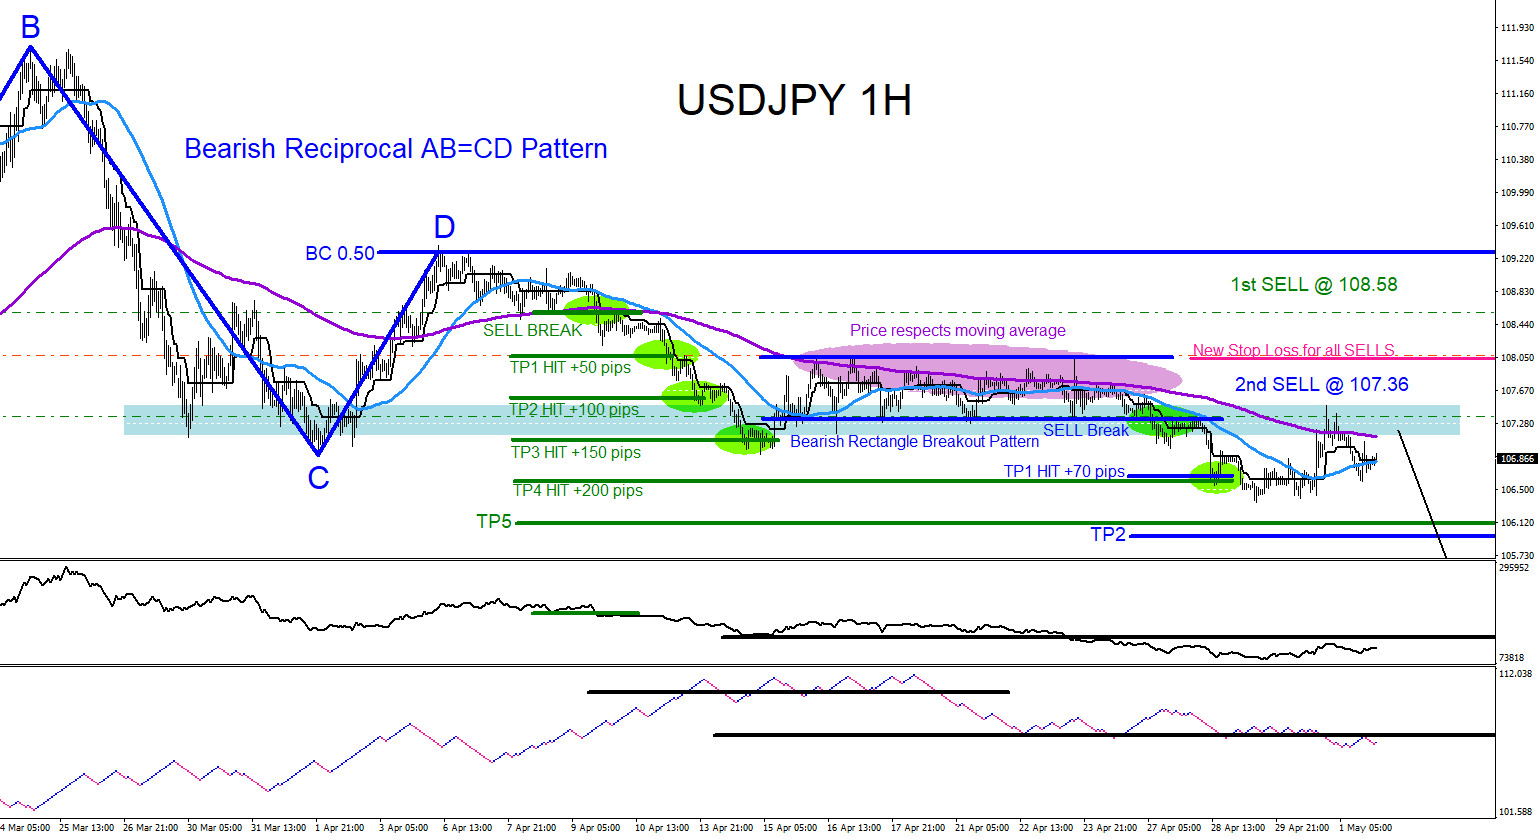
USDJPY 1 Hour Chart April 9.2020 : The chart below was also posted on social media (StockTwits/Twitter) @AidanFX April 9/2020 showing that a bearish reciprocal AB=CD pattern (dark blue) has formed and the pair could make a move lower. I posted price broke below the SELL break level (green) and informed traders to watch for selling opportunities and to watch for a move lower towards the target levels. Indicators also needed to break below the trend lines (black) for more confirmation of downside momentum.
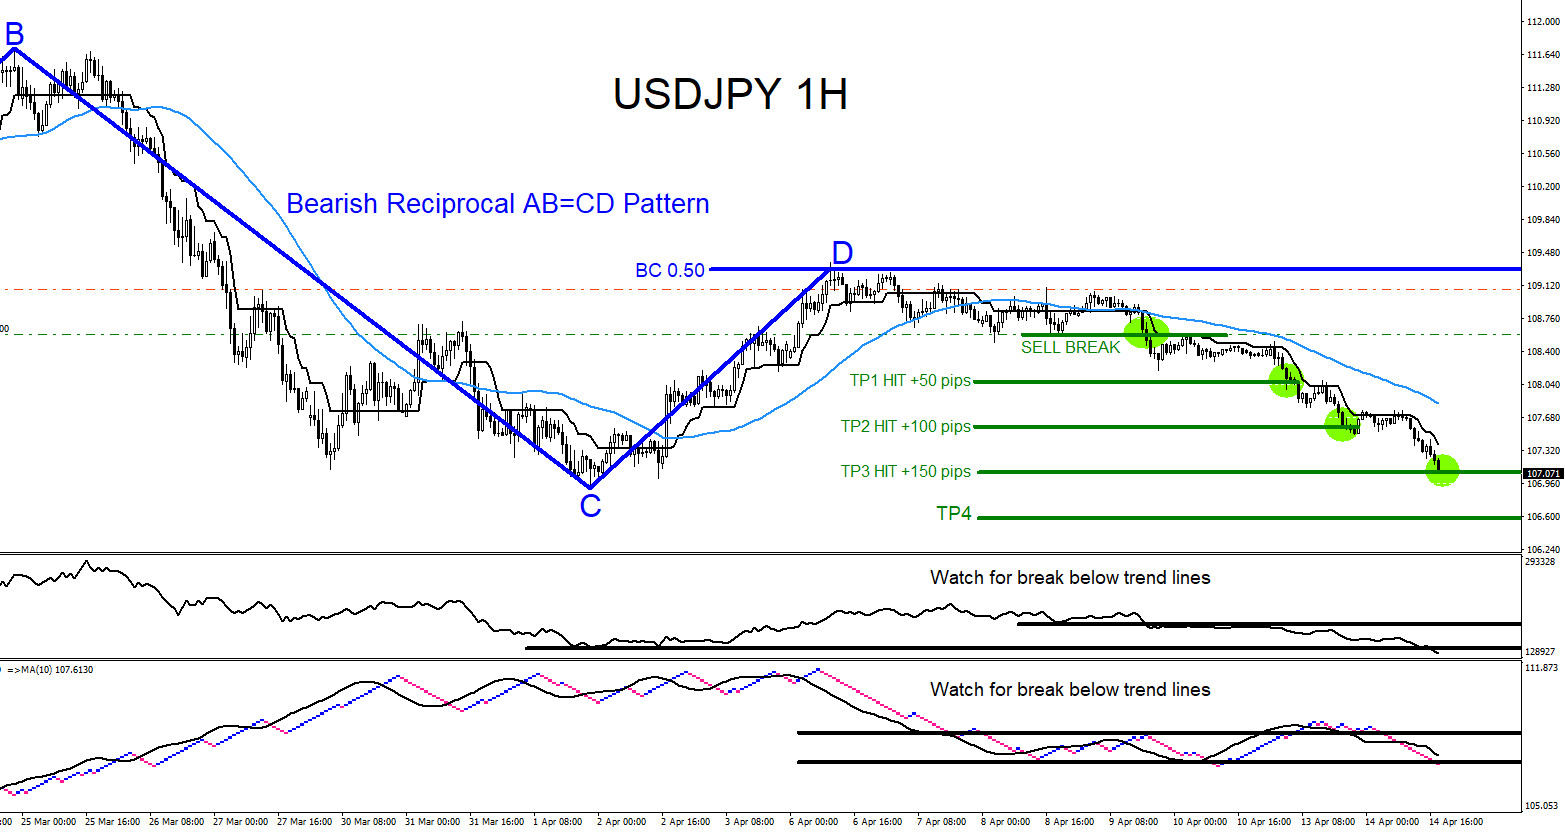
USDJPY 1 Hour Chart April 14.2020 : The pair continues lower hitting target 3 (+150 pips) and indicators broke below the trend lines (black) confirming downside momentum.
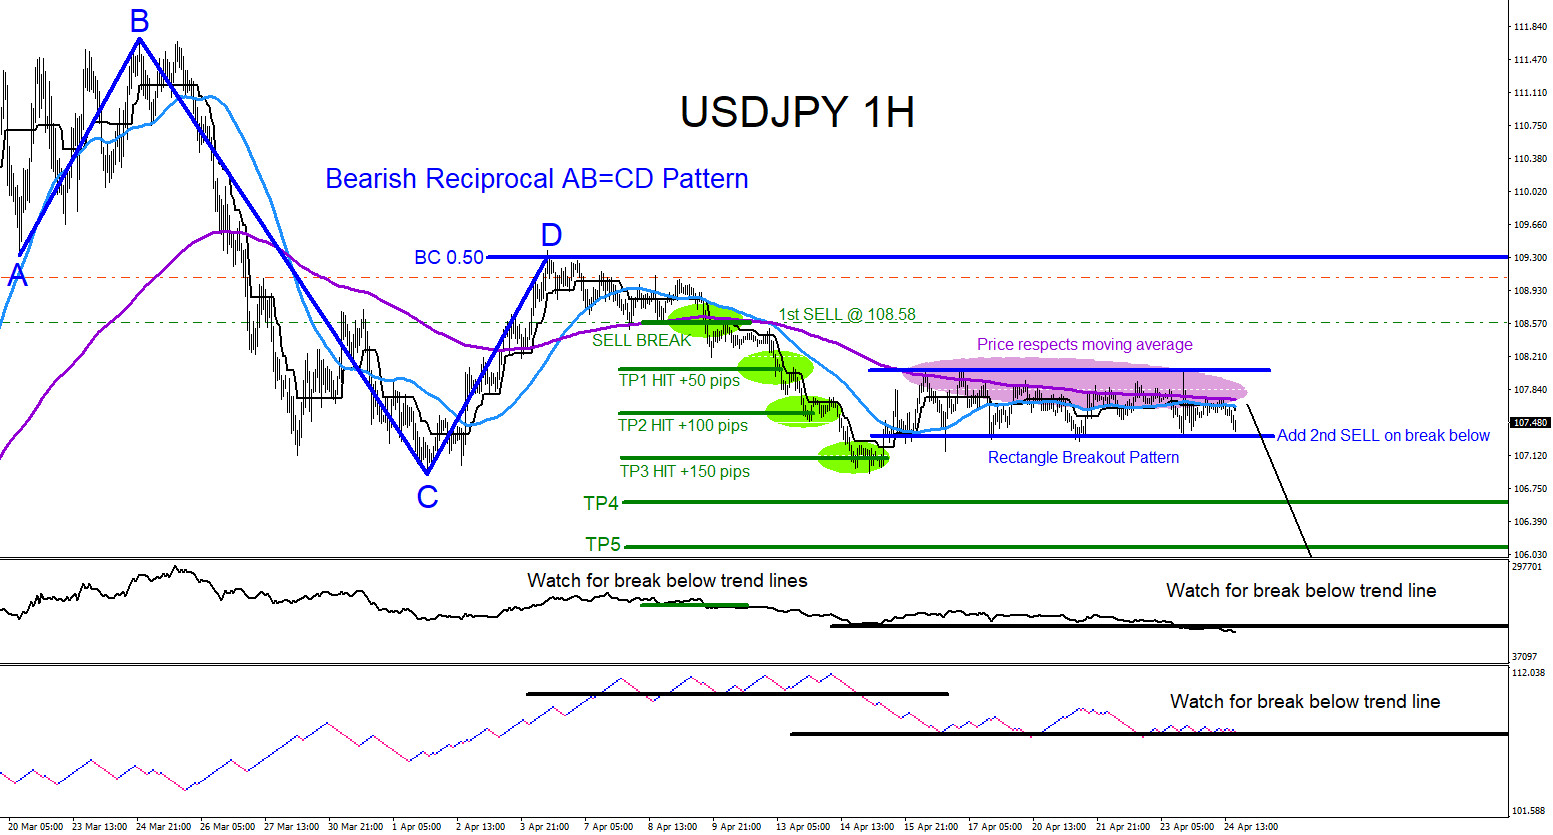
USDJPY 1 Hour Chart April 24.2020 : On April 24/2020 I posted the 2nd SELL setup (blue) calling for another extension lower. Price was respecting the moving average (purple) and a visible rectangle breakout pattern (dark blue) was forming. I informed traders to add sells on the break below the pattern breakout level.
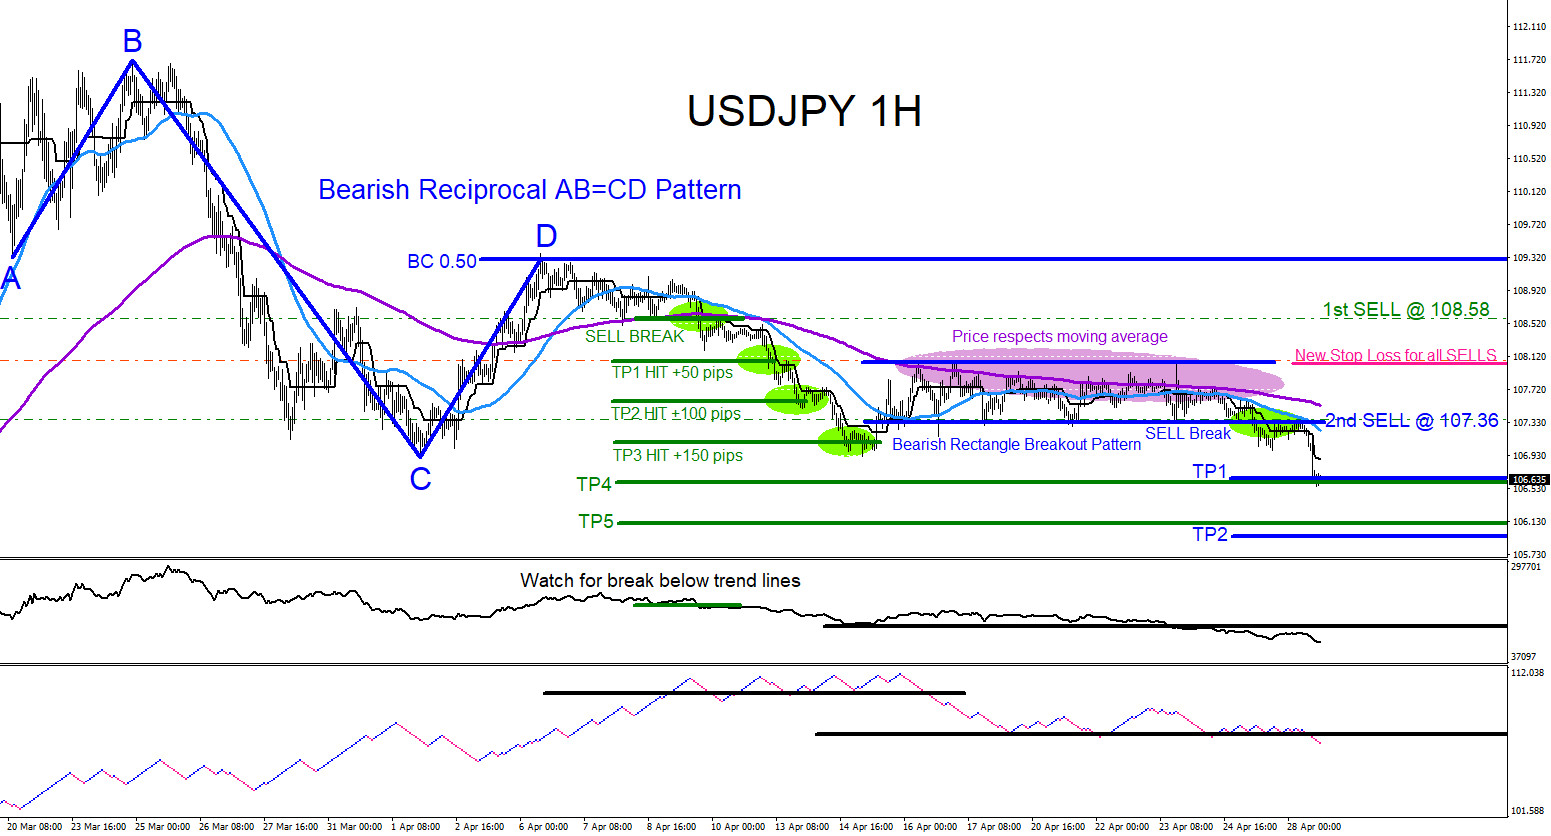
USDJPY 1 Hour Chart April 28.2020 : The pair breaks lower and hits the 1st entry (green) target 4 for +200 pips and hits the 2nd entry (blue) target 1 for +70 pips. New stop loss (pink) for both entries was set at the top of the dark blue rectangle pattern.
USDJPY 1 Hour Chart May 1.2020 : At the end of April and the start of May the pair still has potential to make another round lower. The pair has retested a new support/resistance zone (light blue box) and was followed with a reaction lower. As long as price does not hit the protected stop loss (pink) we can expect another round lower and hit the target 5 (green) and target 2 (blue). If you followed me on Twitter/Stocktwits you too could have caught the USDJPY breakout move lower.
Of course, like any strategy/technique, there will be times when the strategy/technique fails so proper money/risk management should always be used on every trade. Hope you enjoyed this article and follow me on Twitter for updates and questions> @AidanFX or chat me on Skype > EWF Aidan Chan
*** Always use proper risk/money management according to your account size ***
At Elliottwave-Forecast we cover 78 instruments (Forex, Commodities, Indices, Stocks and ETFs) in 4 different timeframes and we offer 5 Live Session Webinars everyday. We do Daily Technical Videos, Elliott Wave Trade Setup Videos and we have a 24 Chat Room. Our clients are always in the loop for the next market move.