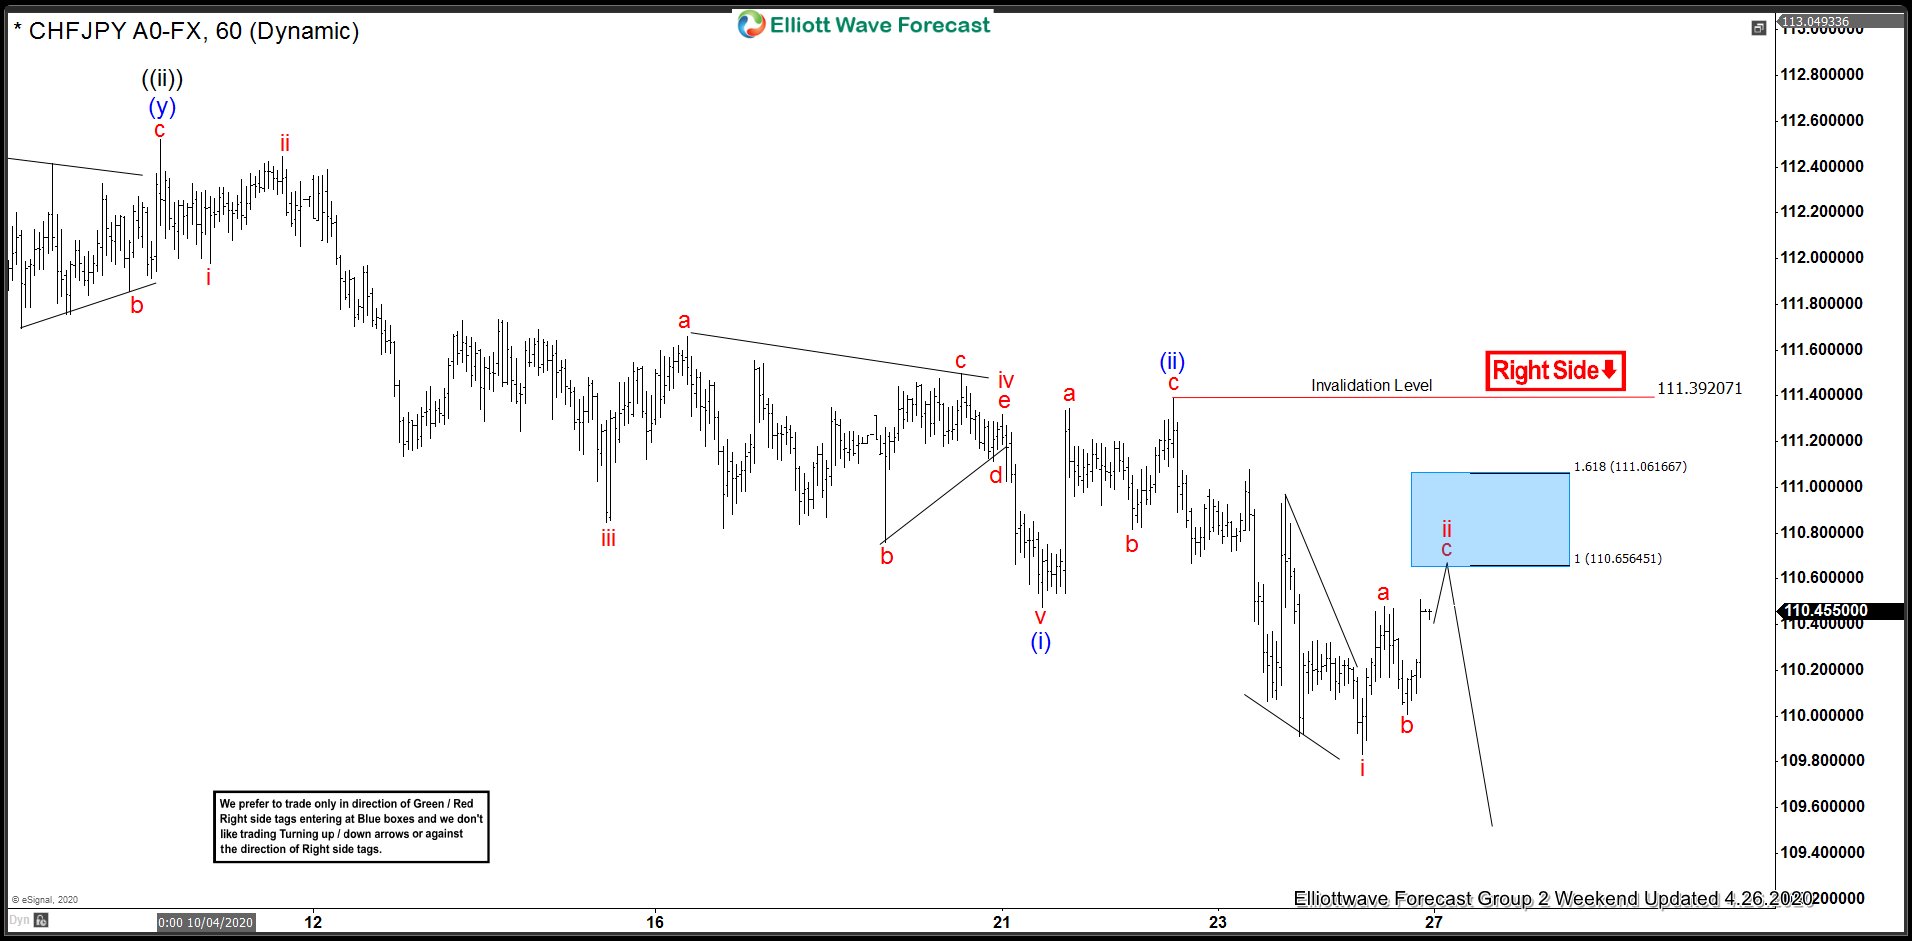
In this blog, we are going to take a look at the Elliott Wave chart of CHFJPY. The 1 hour weekend chart update from 26 April shows that CHFJPY ended wave (ii) bounce at 111.39 high. From there, the pair extended lower and broke below previous wave (i) low. The decline ended at 109.83 low. The pair then bounced in 3 waves as a zig-zag. While below 111.39 high, the bounce is expected to fail and sellers are expected to appear for more downside. The 100% extension of wave a-b where wave c can potentially end is at 110.65 – 111.06 area. We show this area with a blue box. The blue box is the area where we expect sellers to appear for 3 waves pullback at least or an extension lower.
CHFJPY 4.26.2020 1 Hour Weekend Elliott Wave Update
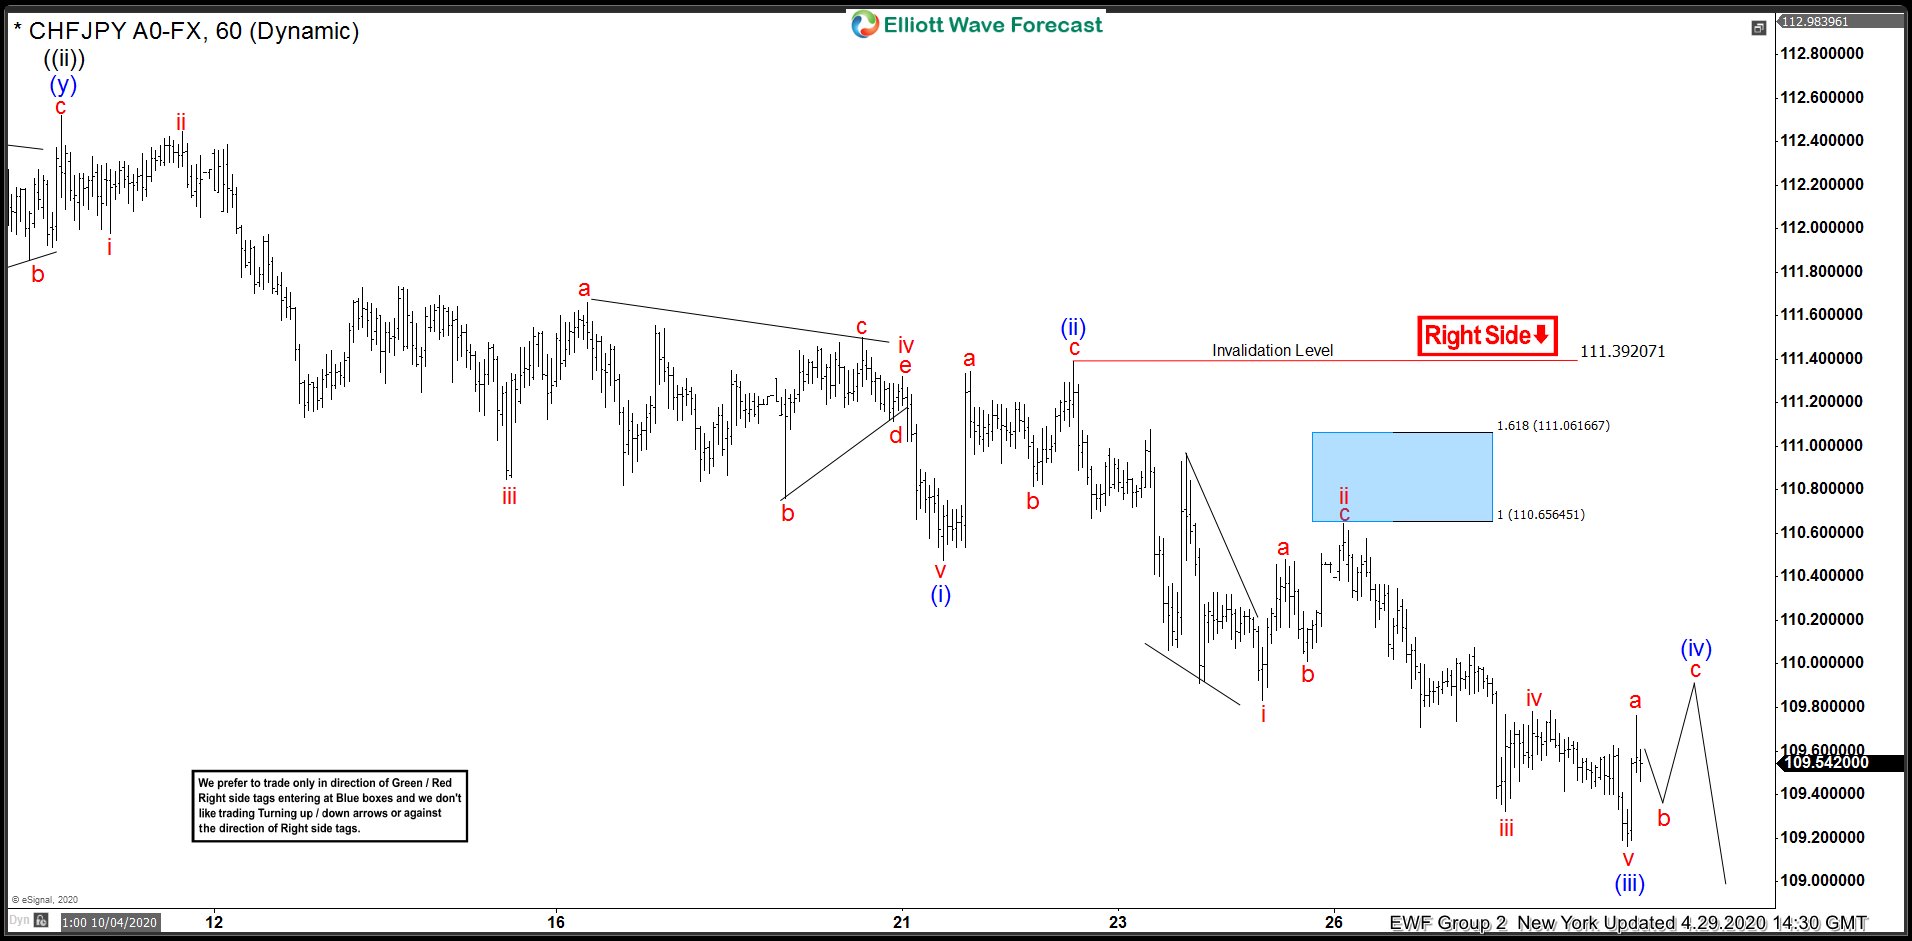
The 1 hour NY chart update from 29 April shows that CHFJPY ended wave ii bounce at the blue box area at 110.65 high. From there, the pair continued to extend lower and broke below previous wave i low. Wave iii ended at 109.32 low and wave iv bounce ended at 109.78 high. The pair then extended another leg lower in wave v to end wave (iii) at 109.16 low. A 3 waves bounce in wave (iv) should follow after that. As long as the high at 111.39 stays intact, expect the bounce in 3,7, or 11 swings to fail again for more downside.
CHFJPY 4.29.2020 1 Hour NY Elliott Wave Update