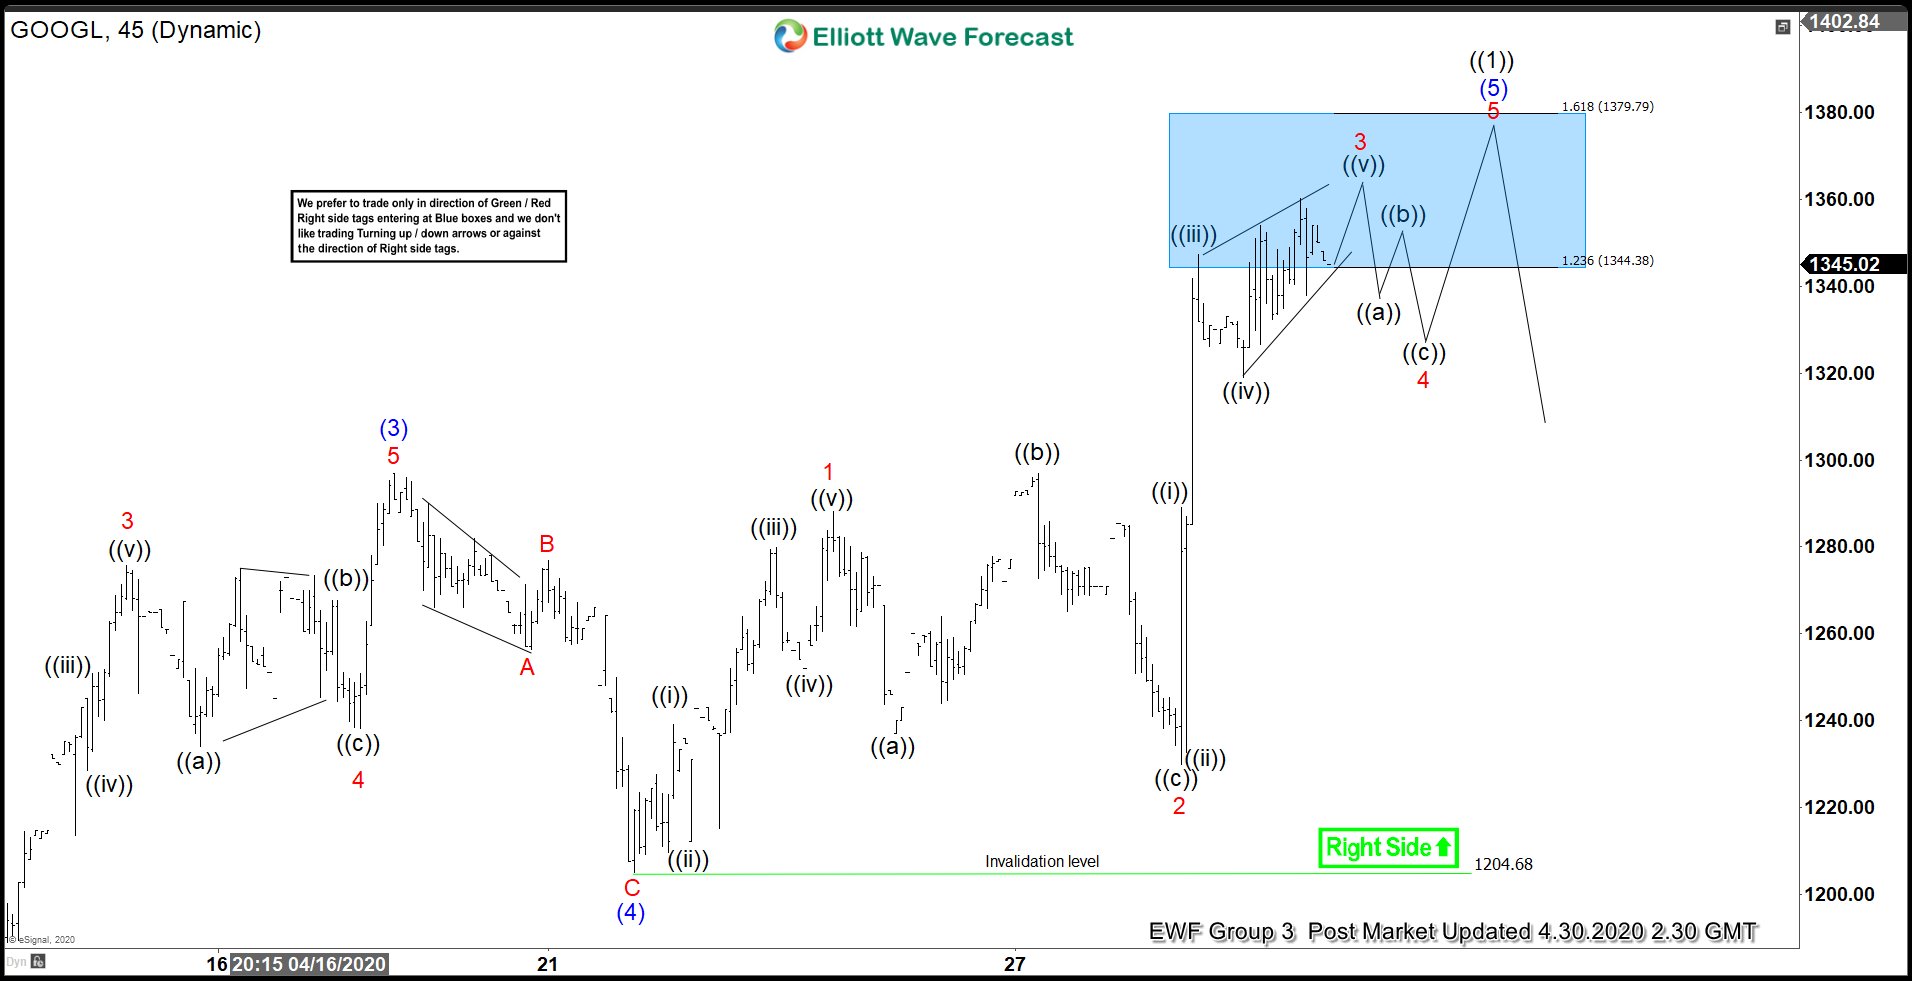
In the aftermath of COVID-19 selloff, Alphabet (GOOGL) formed a low on March 23, 2020 at 1008.87. From there, the stock is rallying as a 5 waves impulsive Elliott Wave structure. Up from 3.23.2020 low, wave (1) ended at 1173.4 and wave (2) pullback ended at 1075.08. The stock then resumed higher in wave (3) towards 1297. The 45 minutes chart below shows the wave (3) rally. It then pullback in wave (4) to 1205. Subdivision of wave (4) unfolded as a zigzag where wave A ended at 1256.44, wave B ended at 1276.82, and wave C ended at 1204.68.
Wave (5) is currently in progress and unfolding as a 5 waves impulse in lesser degree. Up from wave (4) at 1205, wave 1 ended at 1288.15 and pullback in wave 2 ended at 1230. The stock then resumes higher again in wave 3. Near term, while dips stay above 1204.68, expect a few more highs to end wave (5). This should also complete wave ((1)) in higher degree and end cycle from March 23 low. Stock should then pullback in wave ((2)) to correct cycle from March 23 low in 3, 7, or 11 swing before turning higher again.
GOOGL 45 Minutes Elliott Wave Chart