
In this blog, we are going to take a look at the Elliottwave chart of GBPJPY. The 4 hour chart update below from 15 April shows that the cycle from December 12, 2019 high unfolded as 5 waves impulsive structure. Wave 1 ended at 141.14 low. The bounce in wave 2 as a flat correction ended at 144.36 high. From there, the pair continued to extend lower and ended wave 3 at 132.51 low. This is followed by a bounce in wave 4, which ended at 137.21 high. The pair then pushed lower to end wave 5 at 123.99 low.
GBPJPY 4.15.2020 4 Hour London Elliott Wave Update
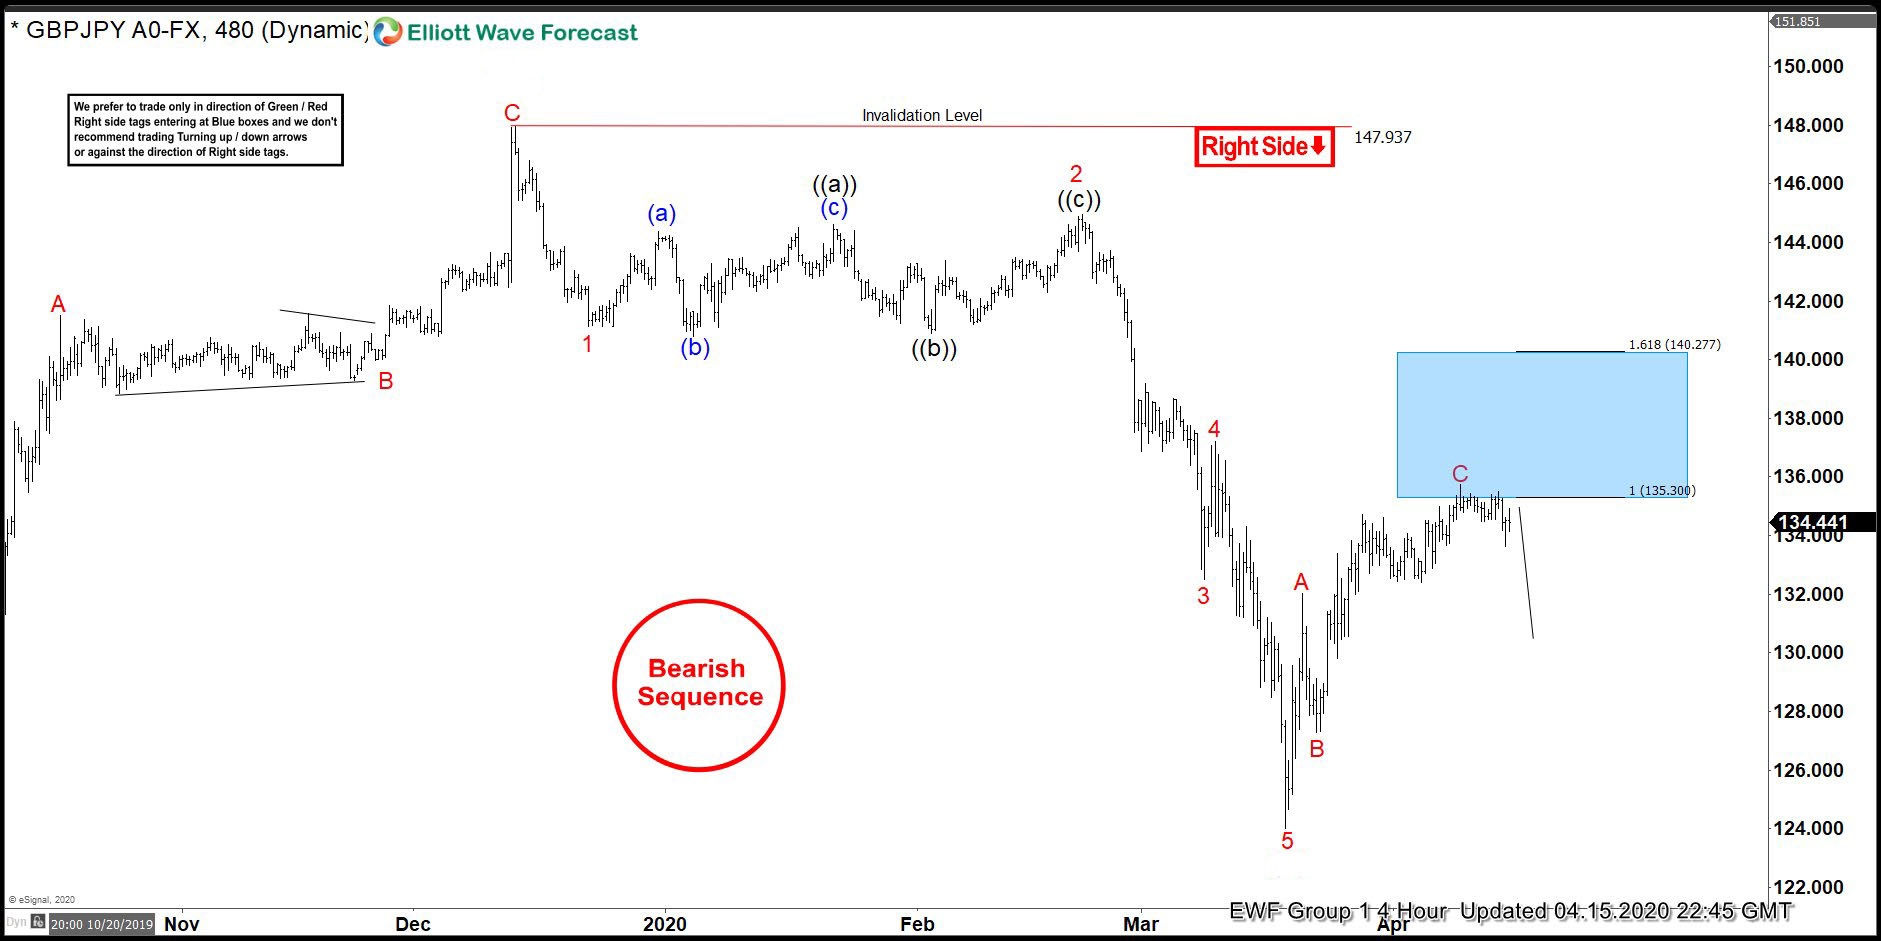
Based on Elliottwave theory, a 3 waves bounce should happen before the decline to the downside resume. As long as the high at 147.94 stays intact, the bounce in 3,7, or 11 swings is expected to fail for more downside later. The expected bounce unfolded as a zig-zag. Wave A ended at 132.04 high and wave B ended at 127.26 low. The 100% extension of wave A-B where wave C can potentially end is at 135.30 – 140.27 area. We showed this area with a blue box. The blue box is the area where we expect sellers to appear for 3 waves pullback at least or an extension lower.
GBPJPY 4.22.2020 4 Hour London Elliott Wave Update
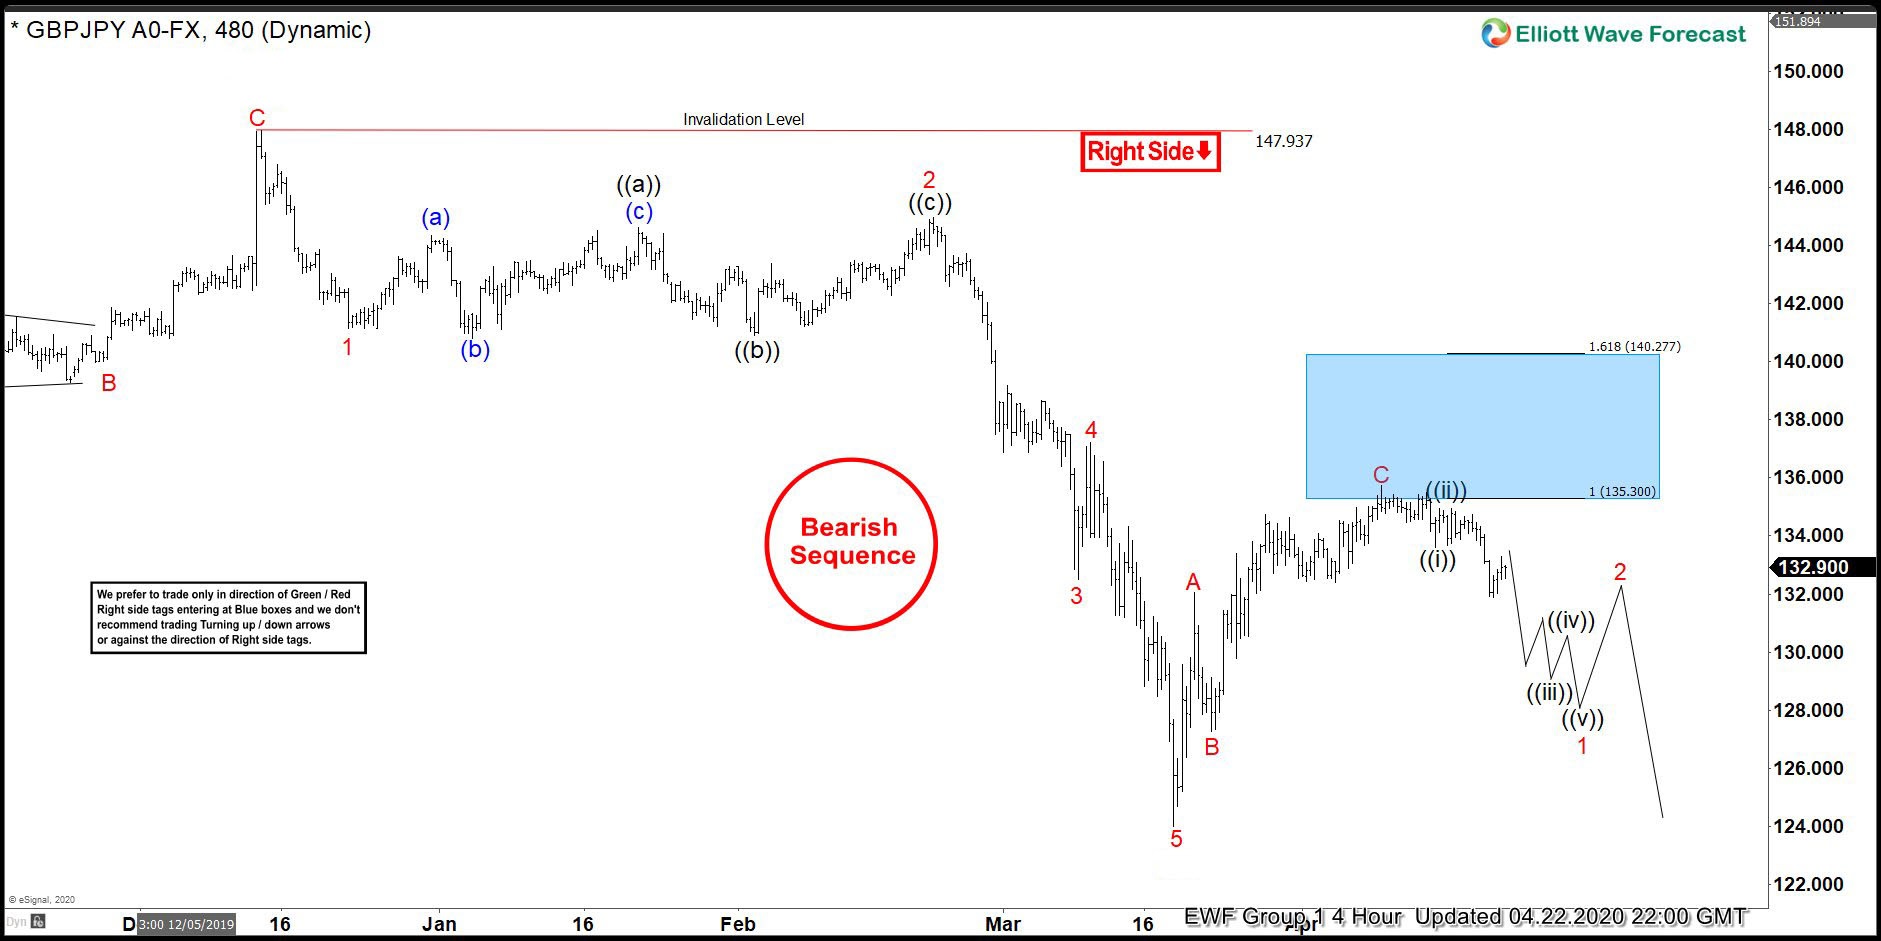
The 4 hour chart update from 22 April shows that the pair reached the equal leg area. Wave C ended at 135.75 high, which is in the blue box area. From there, the pair has extended lower. Wave ((i)) ended at 133.61 low and wave ((ii) bounce has ended at 134.96 high. The pair still needs to break below the previous low at 123.99 to confirm that the next leg lower is in progress and to avoid doing a double correction.