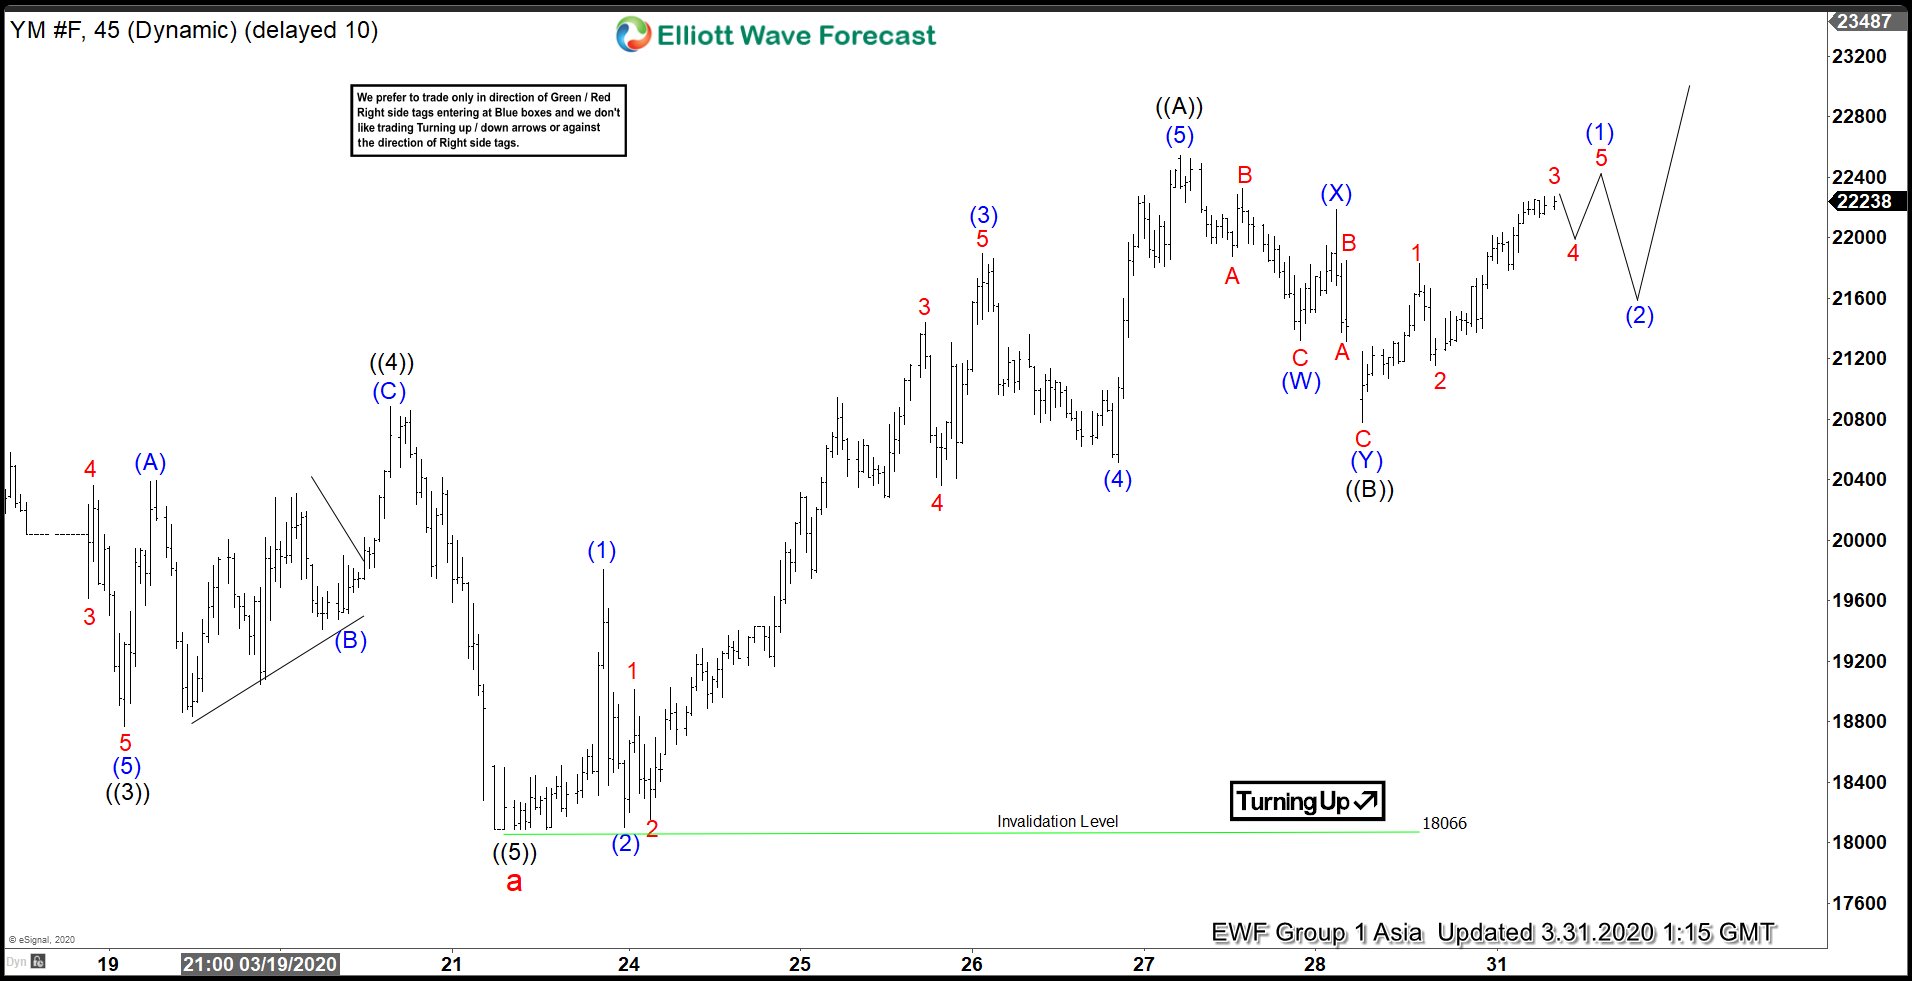
Dow Jones Futures (YM_F) ended the cycle from February 13, 2020 high at 18086 as wave a. Down from February 13 high, wave ((1)) ended at 24675 and wave ((2)) ended at 27075. Wave ((3)) ended at 18766 and bounce in wave ((4)) ended at 20882. Finally, wave ((5)) of a ended at 18086. Wave b bounce remains in progress as a zigzag Elliott Wave structure. Up from 18066, wave ((A)) ended at 22545 as a 5 waves impulse. Wave (1) ended at 19804, and wave (2) pullback ended at 18101. Index then resumes higher in wave (3) towards 21892 and pullback in wave (4) ended at 20510. Finally, wave (5) of ((A)) ended at 22545.
Wave ((B)) pullback is proposed complete at 20778 and unfolded as a double three Elliott Wave structure. Down from 22545, wave (W) ended at 21316 and bounce in wave (X) ended at 22185. Wave (Y) of ((B)) ended at 20778. Index still needs to break above wave ((A)) at 22545 to confirm the next leg higher has started. Near term, expect wave ((C)) to extend higher and while dips stay above 20778, and more importantly above 18066 low, expect the Index to extend higher within wave ((C)). Potential target higher is 100% – 123.6% of ((A))-((B))-((C)) towards 25215 – 28078.
Dow Jones Futures (YM_F) 1 Hour Elliott Wave Chart