
EURGBP Technical Analysis March 30/2020
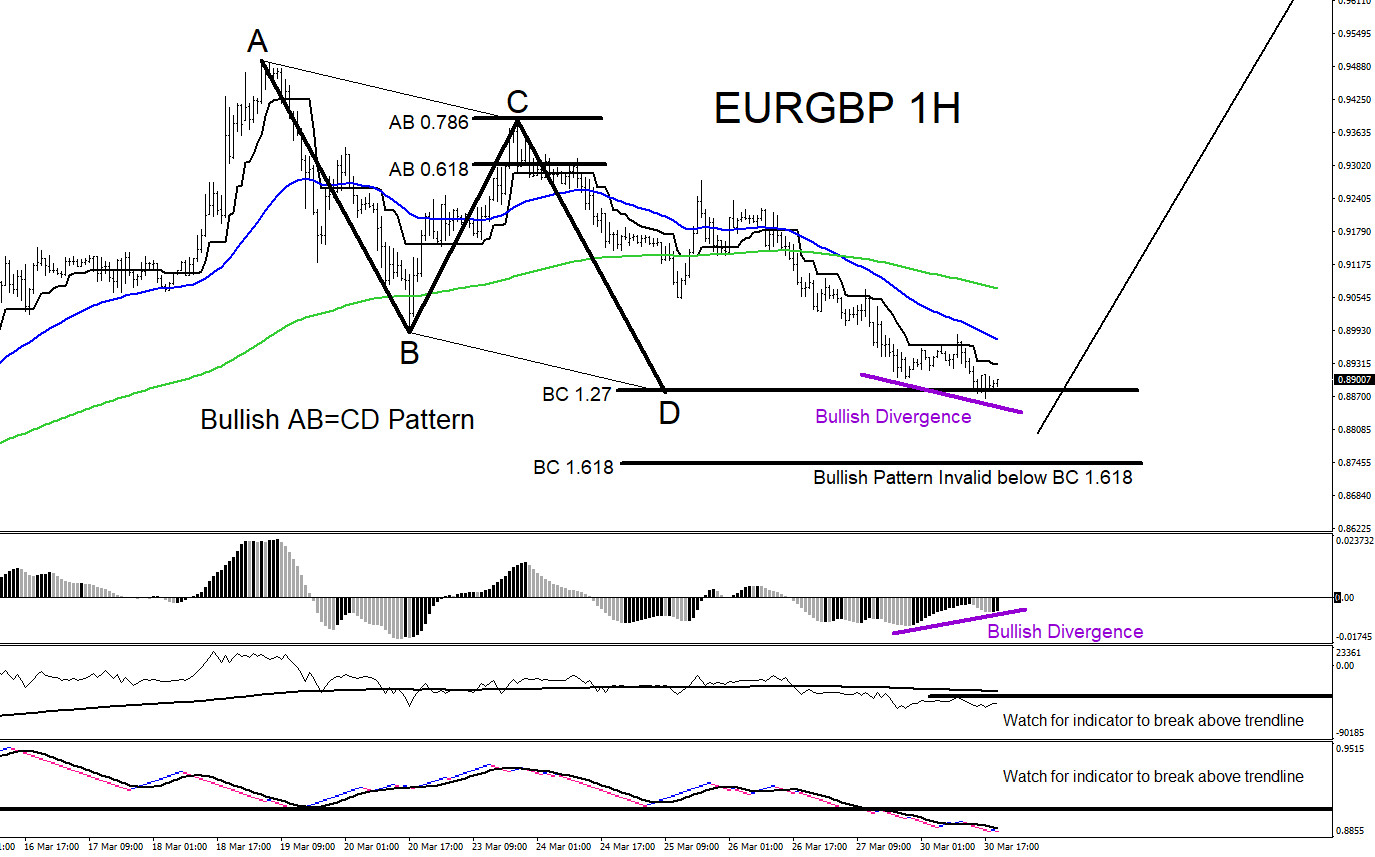
EURGBP : There are clear visible bullish market patterns on the 1 hour chart but traders will still need to wait for more confirmation that a bottom will form and for price to bounce higher. Bullish AB=CD pattern triggers BUYS in the BC 1.27-1.618 Fib. levels. Price has already reached the 1.27 minimum Fib. level and have yet to see if this will be enough for the pair to bounce higher. If price moves below the BC 1.618 level then the bullish AB=CD pattern is invalidated. Another signal that EURGBP can bounce higher is bullish divergence seems to be forming or possibly formed which can also signal buyers to get in the market and push price higher. More confirmation of a possible bottom is when the pair starts to trade above the 50MA (blue) and also if price structure moves in a higher high / higher low sequence to confirm possible trend change. Bulls will be watching a break above 0.8987 level for now. Only time will tell what the pair will do but now you know what to watch for if EURGBP decides to bounce higher.
EURGBP 1 Hour Chart 3.30.2020
Of course, like any strategy/technique, there will be times when the strategy/technique fails so proper money/risk management should always be used on every trade. Hope you enjoyed this article and follow me on Twitter for updates and questions> @AidanFX or chat me on Skype > EWF Aidan Chan
*** Always use proper risk/money management according to your account size ***
At Elliottwave-Forecast we cover 78 instruments (Forex, Commodities, Indices, Stocks and ETFs) in 4 different timeframes and we offer 5 Live Session Webinars everyday. We do Daily Technical Videos, Elliott Wave Trade Setup Videos and we have a 24 Chat Room. Our clients are always in the loop for the next market move.