
In this article, we will look at the American Airlines (AAL) to make sense of the recent huge volatility in the stock market. The world faces a tremendous crisis due to the pandemic created by the Corona virus. The financial markets consequently have entered a tremendous selling pressure. As it always happens, some sectors always get hit the hardest when compared to others. The transportation sector got hit pretty hard and companies like Royal Carribean, General Motors, Boeing, Carnival Cruise Line are all taking a dive lower.
We at EWF have been tracking all those companies and they are all in Grand Super cycle correction. However, we have found out one stock correcting a lower cycle degree which is American Airlines (AAL). Back in 2008 , the stock formed a grand super cycle low at $1.45 per share. Since then it shows a very nice 5 waves advance and then a clear three waves pullback. Below is the structure of 5 waves advance and 3 waves correction:
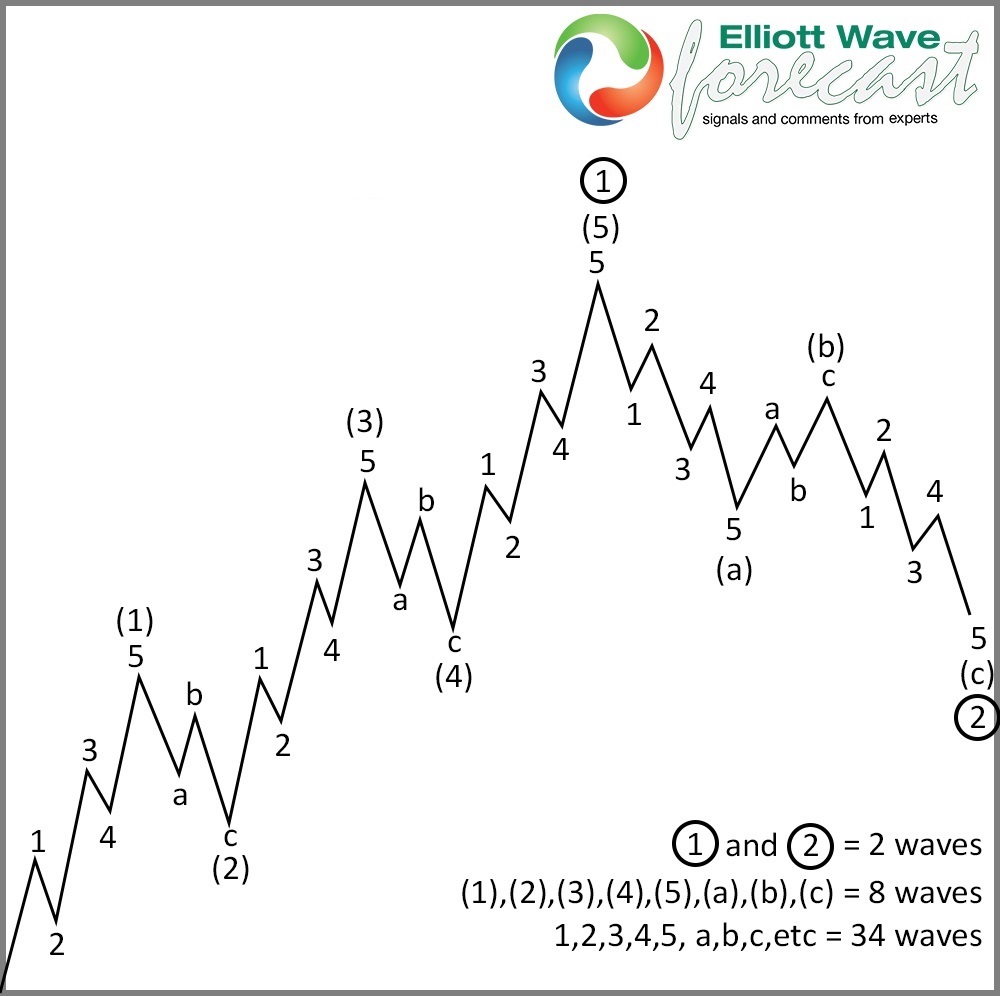
The basic pattern of the Elliott Wave Theory is that market trends in five waves and pullback in three waves. The theory provides three simple rules :
1. Wave 2 can not pass the beginning of wave 1.
2. Wave 3 can not be the shortest of the three impulses.
3. Wave 4 can not overlap with the top of wave 1.
The five waves advance each subdivides into another five waves of lesser degree. All the previous rules need to apply to the 5 waves in lesser degree as well. Wave 2 and Wave 4 needs to subdivide in three waves. The flexible guidelines allow various interpretations / alternate counts which some people believe make it subjective to interpretation. To mitigate this problem, we have created a system which relates the instrument across the market in cycles. With this additional correlation analysis across the market, we can better assign probability of several different scenarios, therefore getting the right Elliott Wave count. Thus, we apply a lot of critical thinking to the theory and consequently the way we trade.
Getting back to American Airlines (AAL), we can see a five wave advance since 2008. The following chart below shows the move higher:
American Airlines (AAL) Elliott Wave Monthly Chart
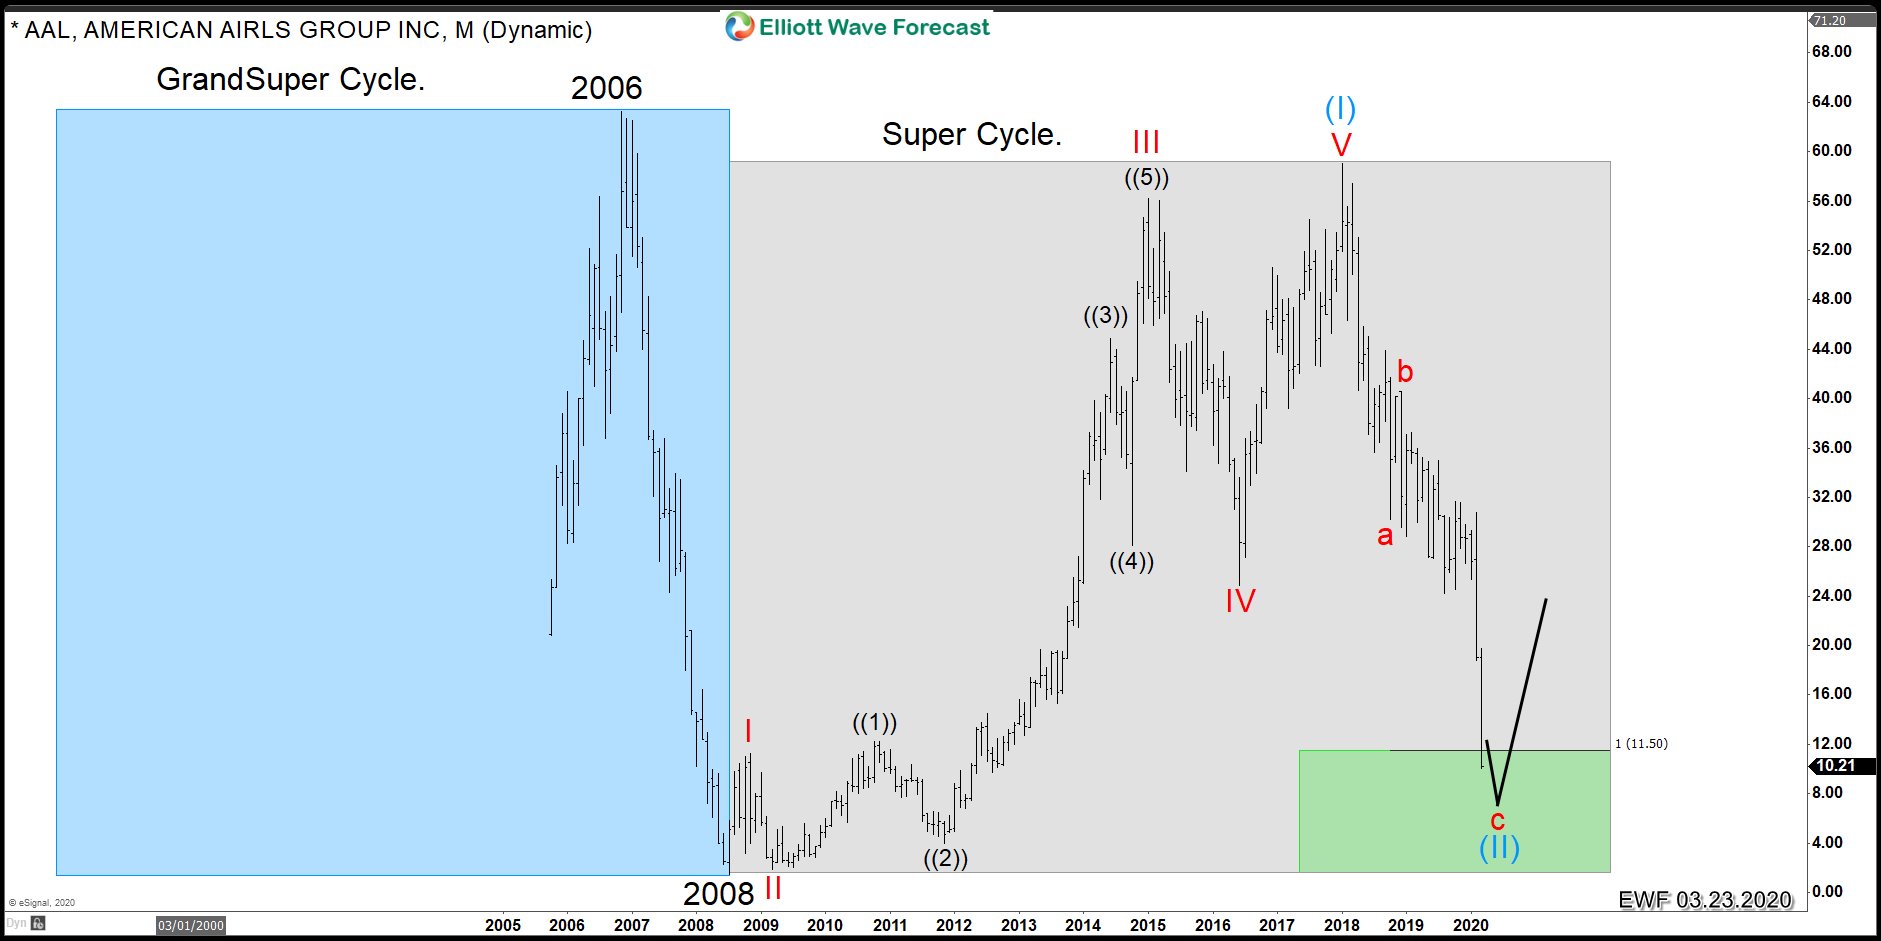
We have divided the chart above into two colors, blue and gray. The blue cycle represents the grand supercycle, which ended in 2006, It then pullback in 3 waves. which ended in 2008. AAL then started to turn higher and rally, but it never took a peak in 2006. This is a very important observation. The idea that 2006 high is still holding means the advance since 2008 is a lesser degree cycle. In terms of Elliott Wave, the advance is in super cycle degree.
The advance is a clear nine swing advance which can be calculated adding the subdivision of the extended wave III. The stock ended the cycle since 2008 and now pulling back in an ABC which already is at the final stage. Again, a very technical advance and decline. As we said before, we use also a lot of critical thinking at EWF. We look at AAL and understand the way the market moves. Although nothing is impossible, it’s hard to see the stock doing a corrective 3 swing from 2006 peak. The reason is if it trades below the 2008 low at $1.45, the 100% extension from 2006 peak will bring the stock to below zero. Using the logic or critical thinking, AAL is too big to fail at this time, same with Royal Carribean, General Motors, Boeing, and Carnival Cruise. As always, nobody knows the future but doing the same over and over makes the difference between a winning trader and the one which does not last.