
OPEC’s failure to strike a deal to cut production output with Russia caused Saudi Arabia to slash oil’s prices in an all-out price war. US West Texas Intermediate Crude plunged more than 30% to $27.9 per barrel while Brent crude futures cratered 29% to $32 per barrel. On Saturday, Saudi Arabia announced a huge price slash to the April selling price and it’s also ready to ramp up production to above 10 million barrels per day.
Oil prices have already plunged this year as market anticipates softer demand due to coronavirus shock. A potential supply glut now further puts pressure on Oil’s price. Russia’s refusal to come into agreement to cut oil production quota can be an attempt to counter US shale producers and also retaliate against the U.S targeting the Nord Stream 2 gas pipeline connecting Russia and Germany. Price has now broken below the 2016 low at $26.05. How low can it go? We will take a look at the long term Elliottwave chart below:
Oil (CL_F) Weekly Elliott Wave Chart
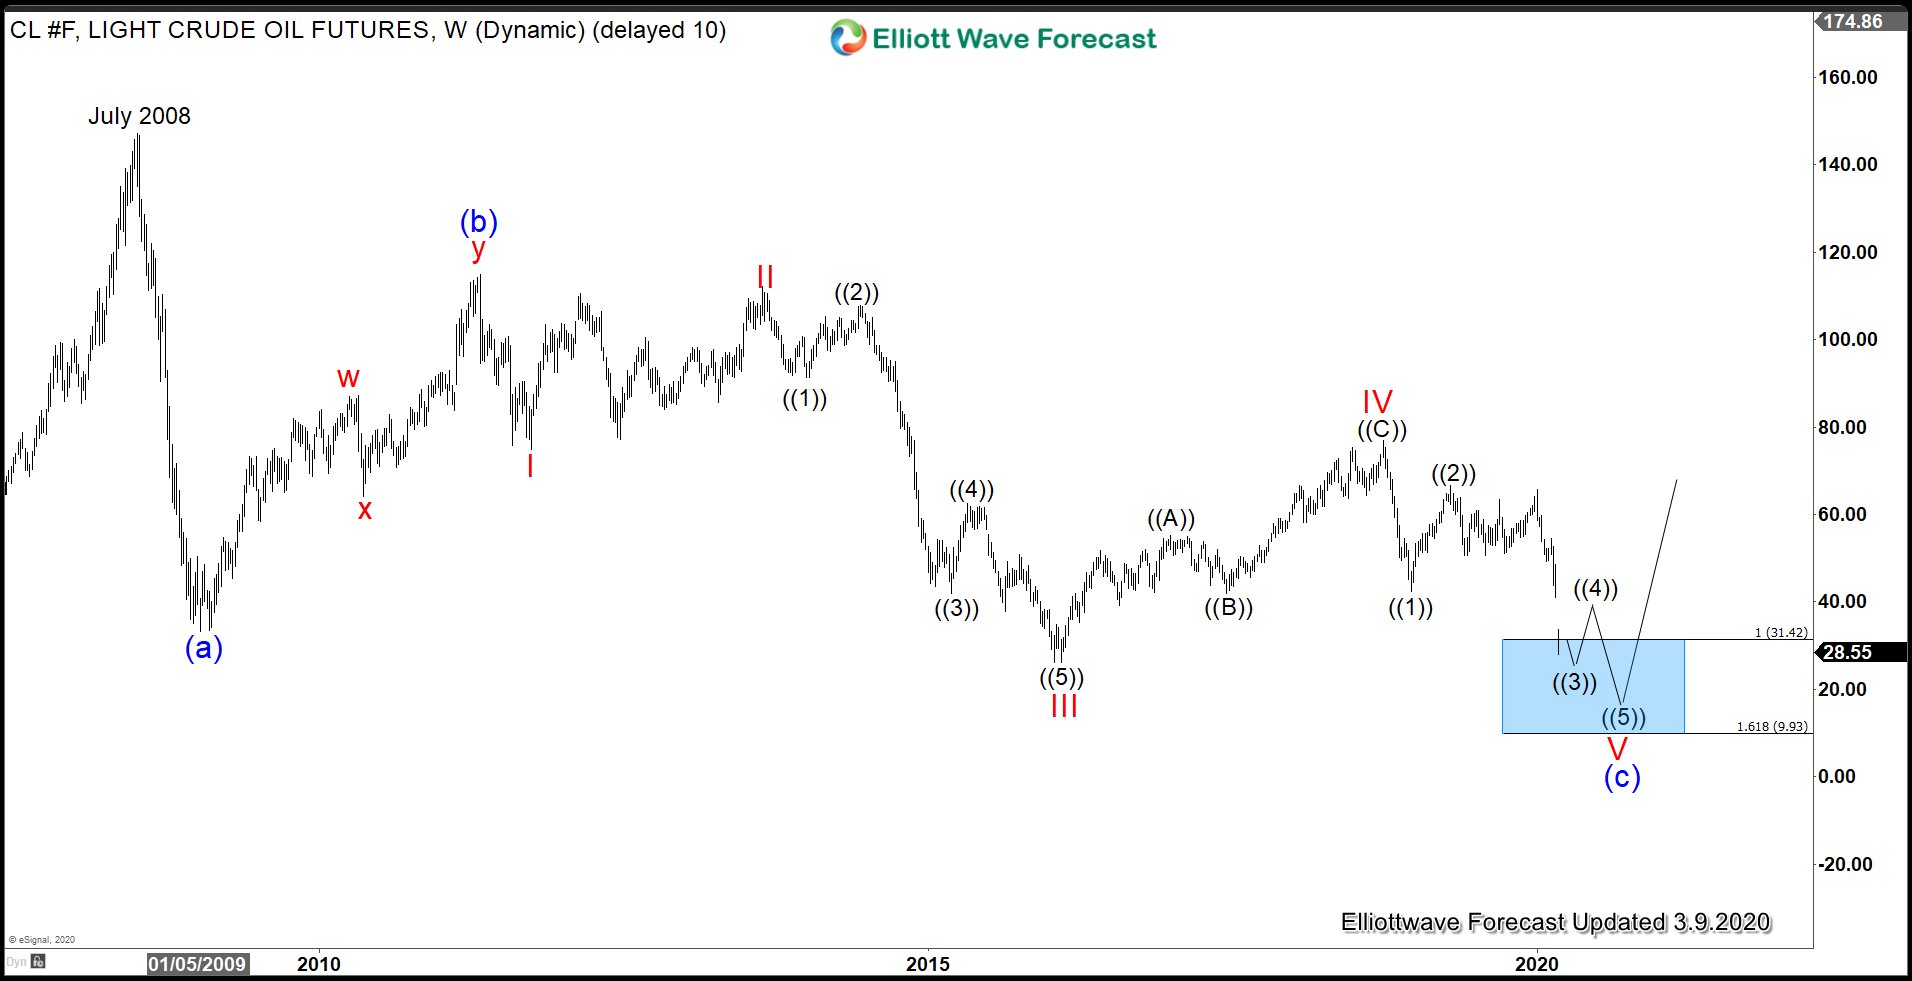
We can look at the price structure from July 2008 high as a zigzag Elliott Wave structure. Down from July 2008 high, wave (a) ended at $33.2 and bounce in wave (b) ended at $114.83. Wave (c) is in progress as a 5 waves where wave I ended at $74.95, wave II ended at $112.24, wave III ended at $26.05 and wave IV bounce ended at $76.9. Oil has now broken below wave III at $26.05 suggesting the next leg lower wave V has started.
Internal of wave V should subdivide into another 5 waves of lesser degree where Oil now can be still within wave ((3)) of V. Although it should be very clear to everyone, in this kind of day where emotion runs high, we should be rational and understand that Oil will never go to $0. We have a couple of ways to estimate the target price for Oil. A 100% extension target from July 2008 is $1.22, a very unlikely scenario as that will go below 1985 price. Unless we are in existential threat as human race due to the coronavirus, that should not come to pass. Another way to measure is a 100% – 161.8% extension area from October 2018 high. Using this method, the area is between $9.9 – $31.4. We have reached this area but still can see a couple more lows before ending the cycle from 2008 high.
Conclusion
Oil has resumed lower as a result of Oil’s price war. However, from Elliott Wave point of view, it is in the area for long term investors to start accumulating. For investors who trade with real money and no leverage and those who have the stomach to get short term volatility to the downside, this could be one of the best times to accumulate Oil at a huge discount. It’s always hard to time a reversal and investors might have to wait for many years and suffer further selloff in the short term, but with long enough investing time horizon, it may turn out to be one of the best investments. Short term traders are better off to avoid the instrument as it’s volatile and risky at this stage. Chasing the downside at this particular level does not have a good risk to reward profile.