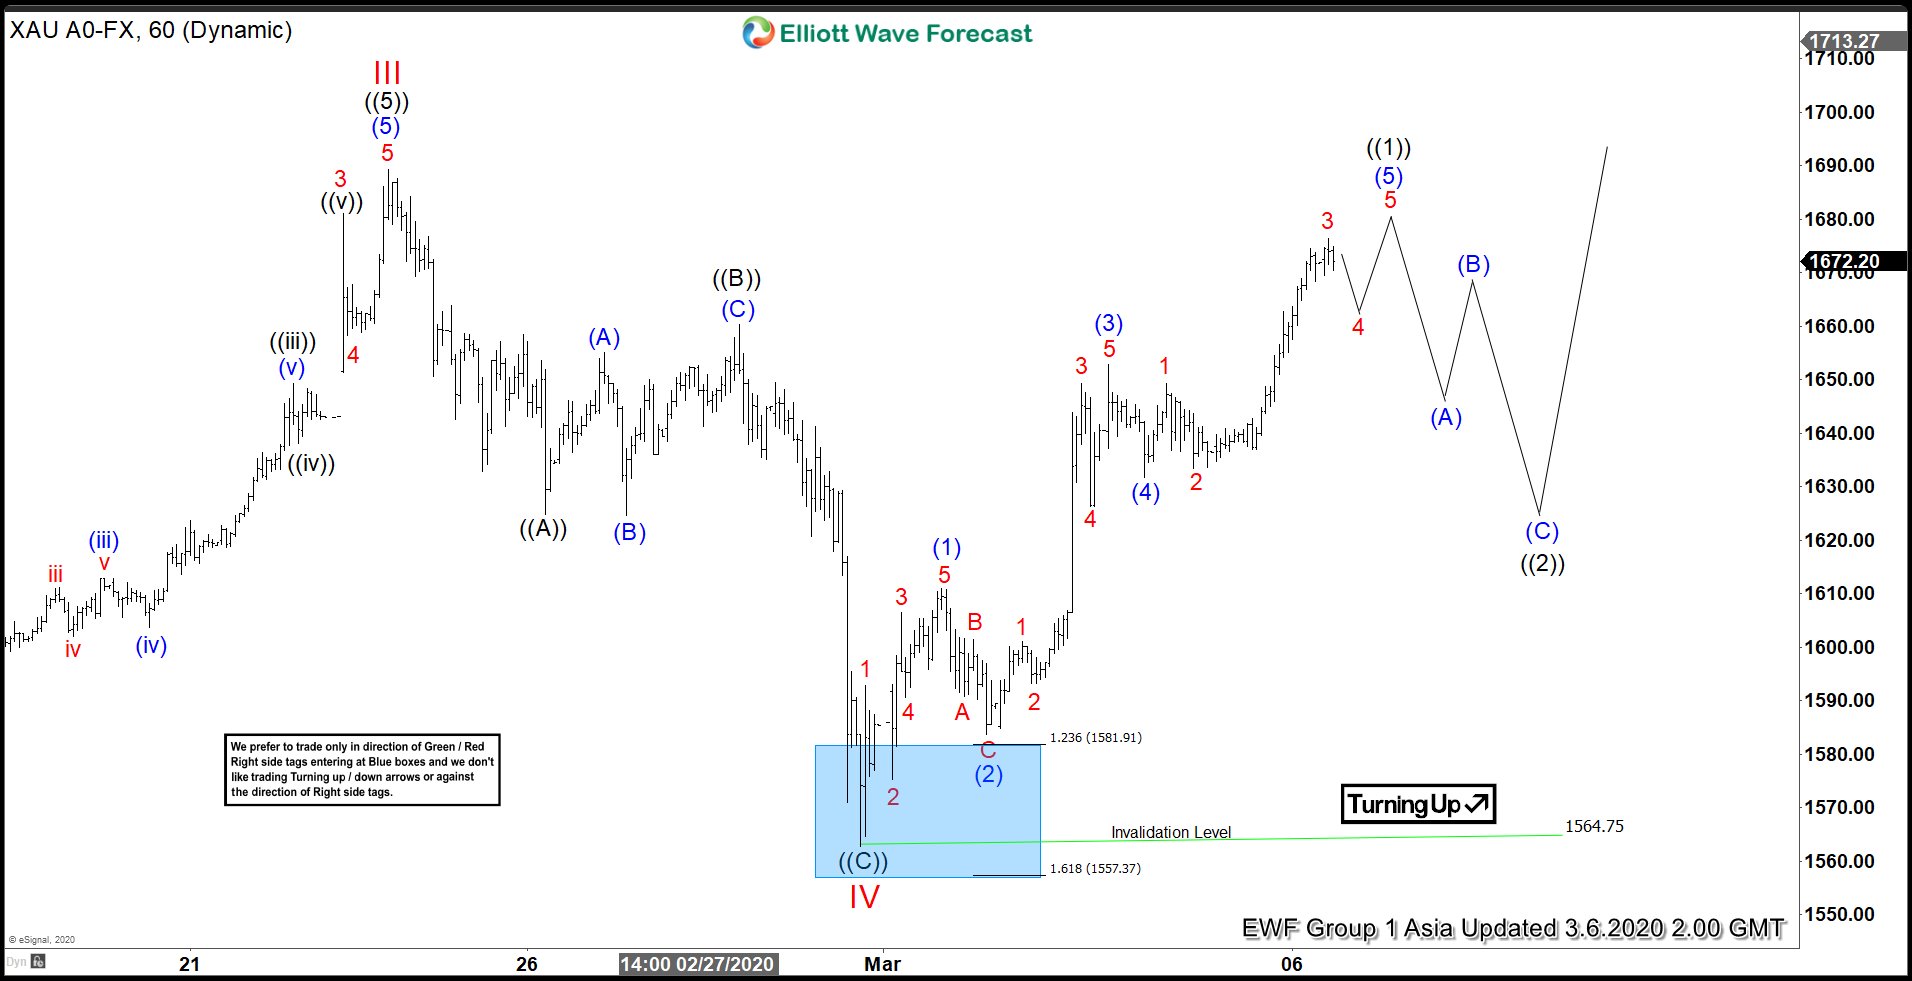
Short term Elliott Wave view in Gold (XAU) suggests the rally from August 2018 low in wave III has ended at 1689.30 high. Gold then corrected that cycle in wave IV as a zig-zag. Wave ((A)) of IV ended at 1624.80 low. The bounce in wave ((B)) unfolded as a flat correction and ended at 1660.37 high. From there, gold extended lower in wave ((C)) to end wave IV. The move lower in wave ((C)) ended at 1564.75 low and reached the blue box area. Up from wave IV low on February 28, gold has extended higher as a 5 waves impulsive structure in wave ((1)).
Wave (1) of ((1)) ended at 1610.99 high and wave (2) pullback ended at 1583.78 low. Wave (3) rally then ended at 1652.81 high. The pullback in wave (4) ended at 1631.70 low. Currently, wave (5) remains in progress, which subdivides in lesser degree 5 waves. Wave 1 of (5) ended at 1649.38 high and wave 2 pullback ended at 1633.50. The metal then rallied higher in wave 3 and ended at 1676.50 high. Near term, the metal is doing a pullback in wave 4 before another push higher in wave 5 to end wave (5). Afterwards, wave ((2)) pullback should happen before the rally continues. While above 1564.75 low, expect pullback to find support in 3, 7, or 11 swings for more upside.
Gold (XAU) 1 Hour Elliott Wave Chart