
Gilead Sciences ($GILD) showing signs that it may be in the beginning stages of new bullish cycle. The Long term chart shows a completed bullish sequence in 5 waves for Blue (I) which topped on June 22/2015 at 123.37. From there a corrective sequence took place for Blue (II) which bottomed on Dec 26/2018 at 60.32. From there a new bullish cycle may be starting with an equal legs area of 183.78 to 260.01 for Blue (III).
Gilead Sciences Elliott Wave Monthly View

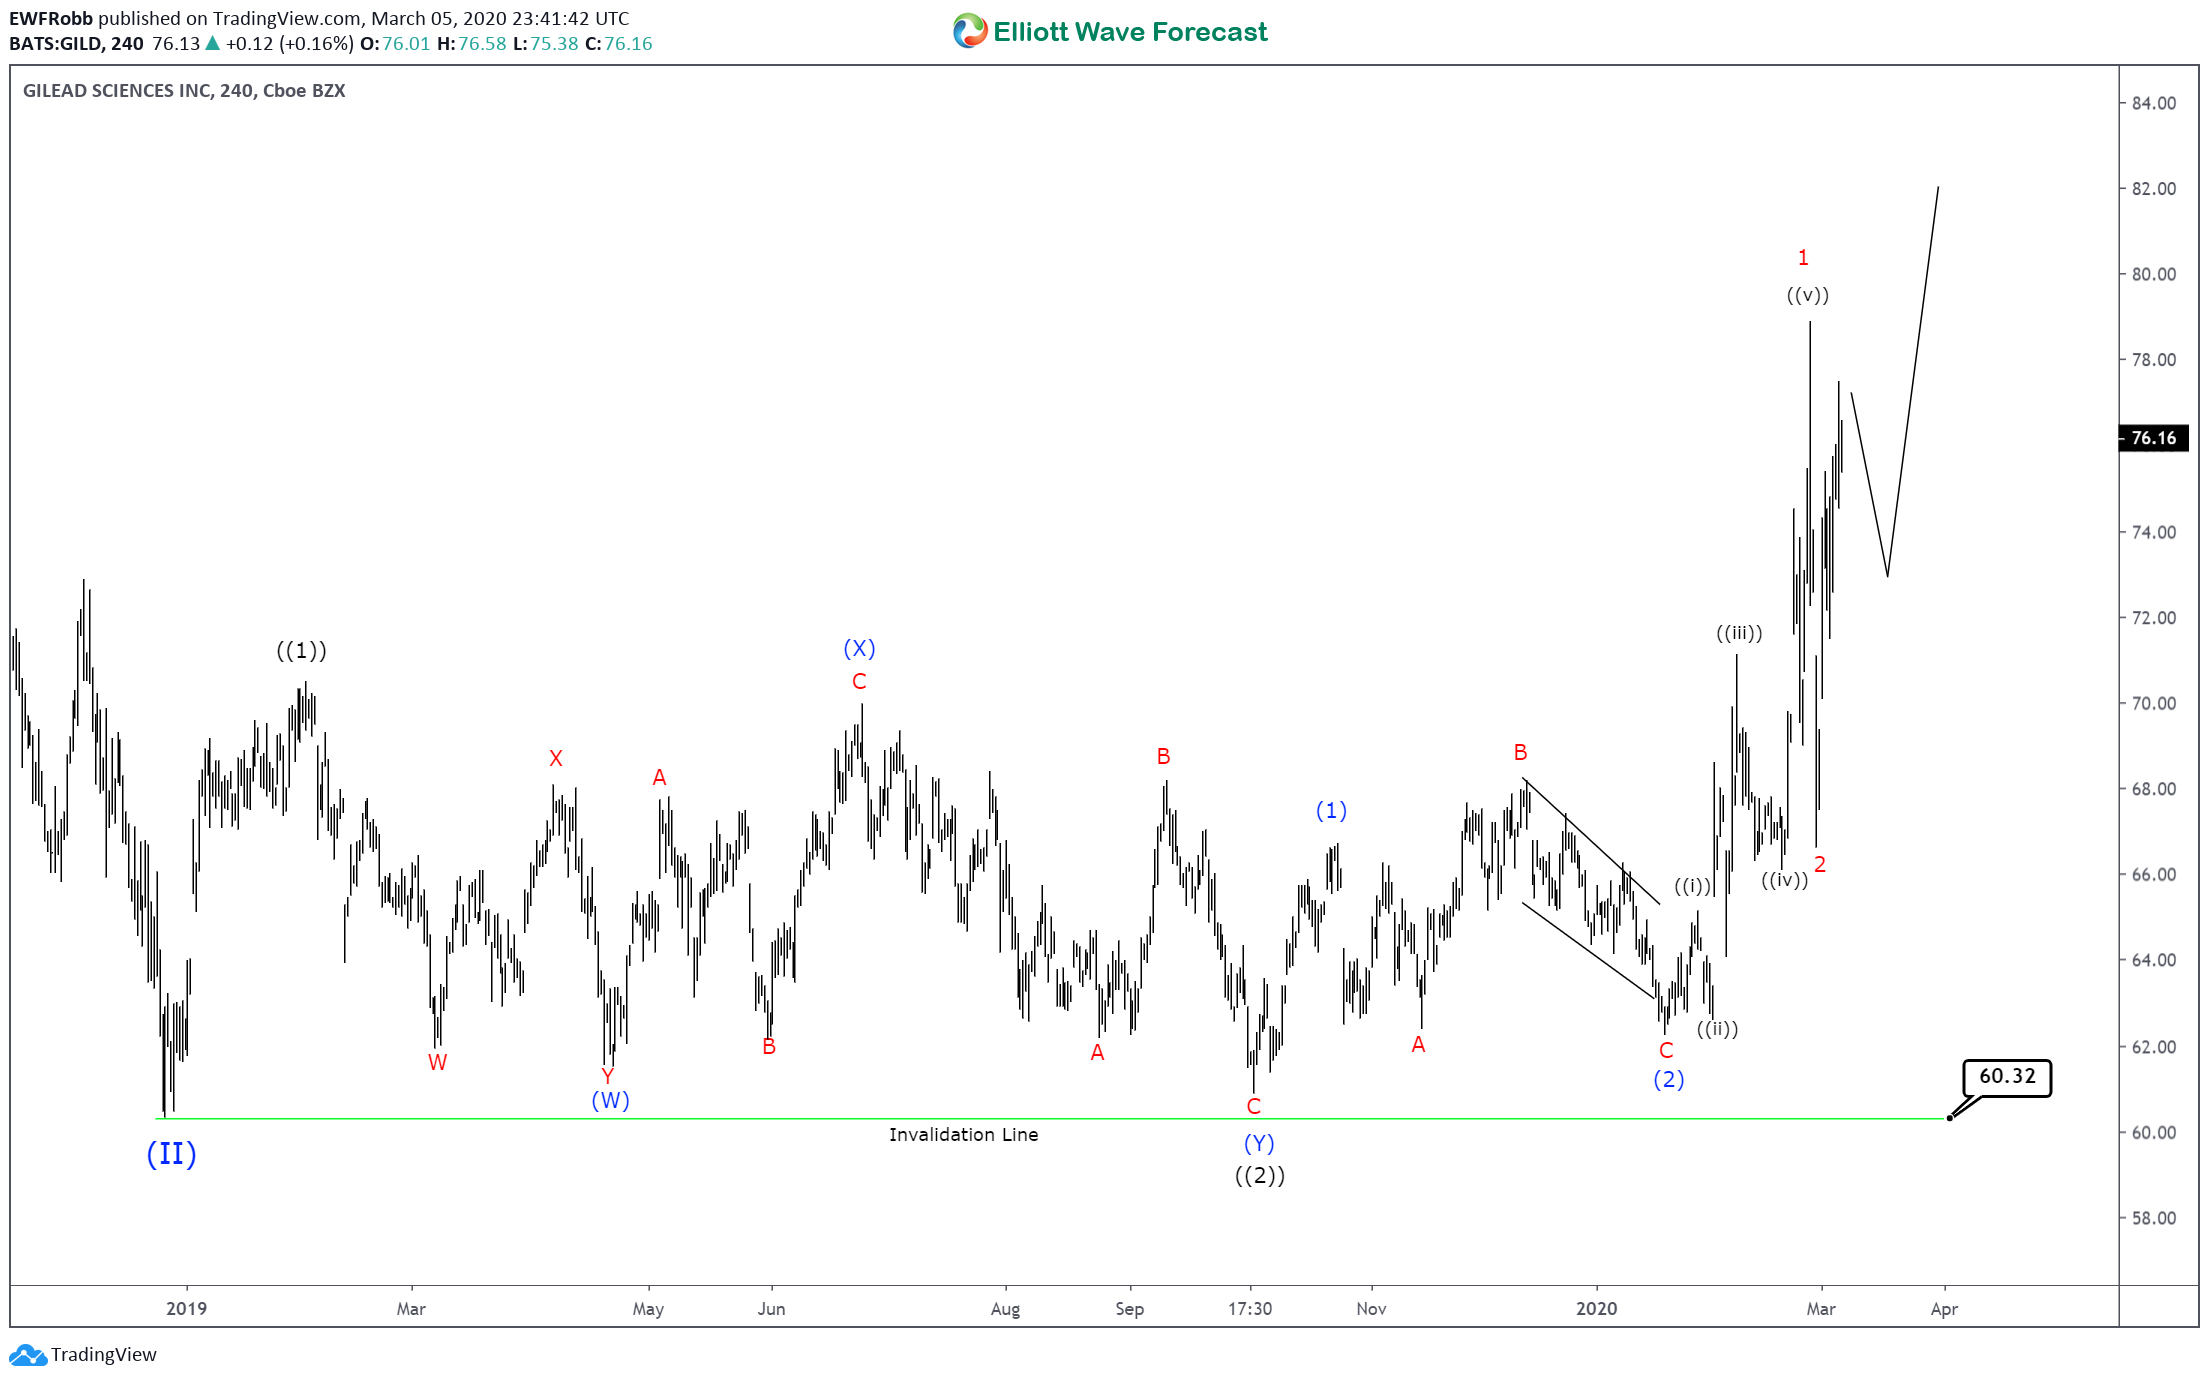
On a 4h view, wave ((1)) topped on Feb 1/2019 at 70.50. A lengthy wave ((2)) then took place in the form of a double zig zag correction. Wave ((2)) bottomed on Oct 3/19 at 60.89 and from there some nesting has started. Blue wave (1) is set on Oct 24/19 at 66.75 and Blue (2) with an expanded flat correction is set on Jan 21/20 at 62.23. From there another 5 waves up has been set, for a nesting red 1-2 taking place. Price action suggests a wave 3 break out is imminent.
Gilead Sciences Elliott Wave 4H View
The Corona Virus (COVID-19) has brought a lot of attention to Gilead recently. However, the Elliott Wave analysis suggests that Gilead Sciences had a bullish setup before the virus surfaced. The momentum from the virus may be but one small element that helps push Gilead to new all time highs.