
$GBPCHF FX Pair Long Term Cycles & Swings
Firstly as seen on the monthly chart below there is data back to the early 1970’s readily available in the pair. It obviously had a central bank intervention during the month of October 1974 where price topped out at 6.3387. Most all Elliott Wave practitioners are geared to the notion that a trend will be in 5 waves and a correction against the trend will be in 3 waves back against the trend. That is generally true especially if counting the stock market indices however it is really hard and next to impossible to find long term forex charts like this that will will show a clean 5 waves.
Secondly with the aforementioned thought in mind I will describe how I think the pair has declined thus far & what can be seen in the future. You can see the decline from October 1974 highs has a line drawn down to the October 1992 lows. That can be counted in Elliott wave a couple of best ways at a minimum and as usual there are usually a few counts that can be valid. This point at the October 1992 lows appears to be a double three. I prefer to use momentum indicators to show when a cycle ends from any point in time. Whenever a proposed wave two, B, X or wave four of any degree has been taken by the momentum indicator it is likely it has ended that cycle whether it is up or down.
The analysis continues below the monthly chart.
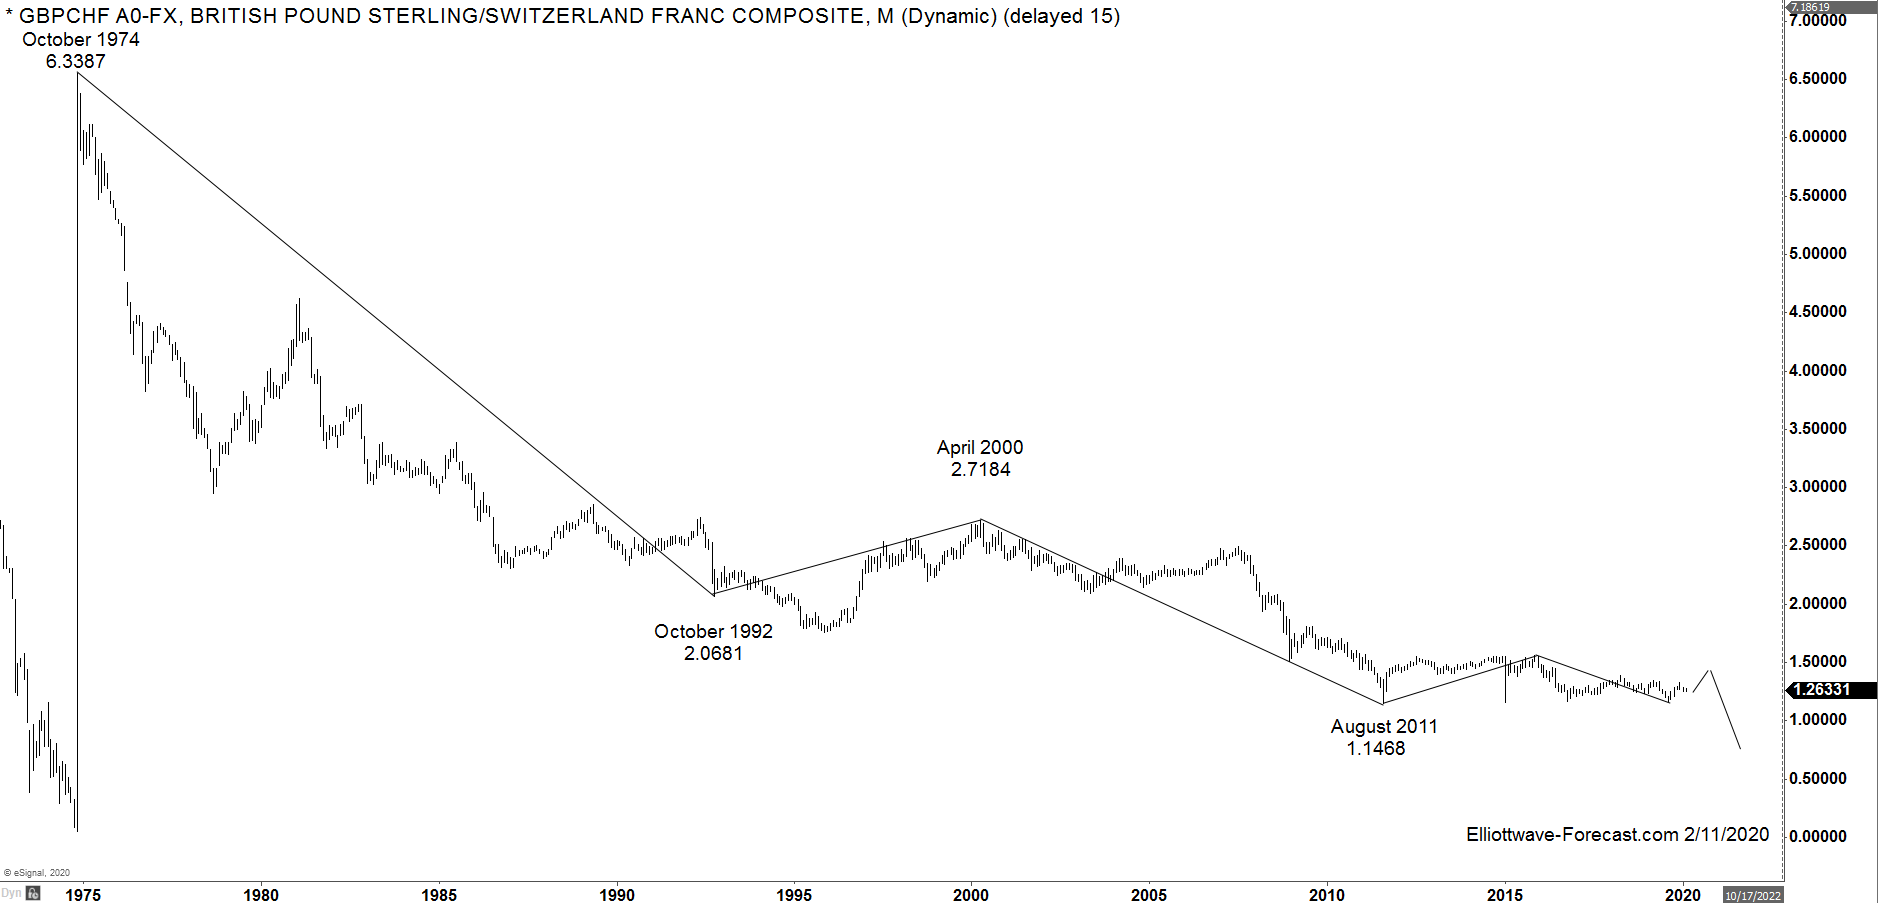
From the October 1992 low the pair bounced hard enough to the April 2000 highs to suggest it correcting the cycle from the October 1974 high in a flat structure. The pair made another low since then in August 2011. I think it will eventually take out that low.
The analysis concludes below the weekly chart.
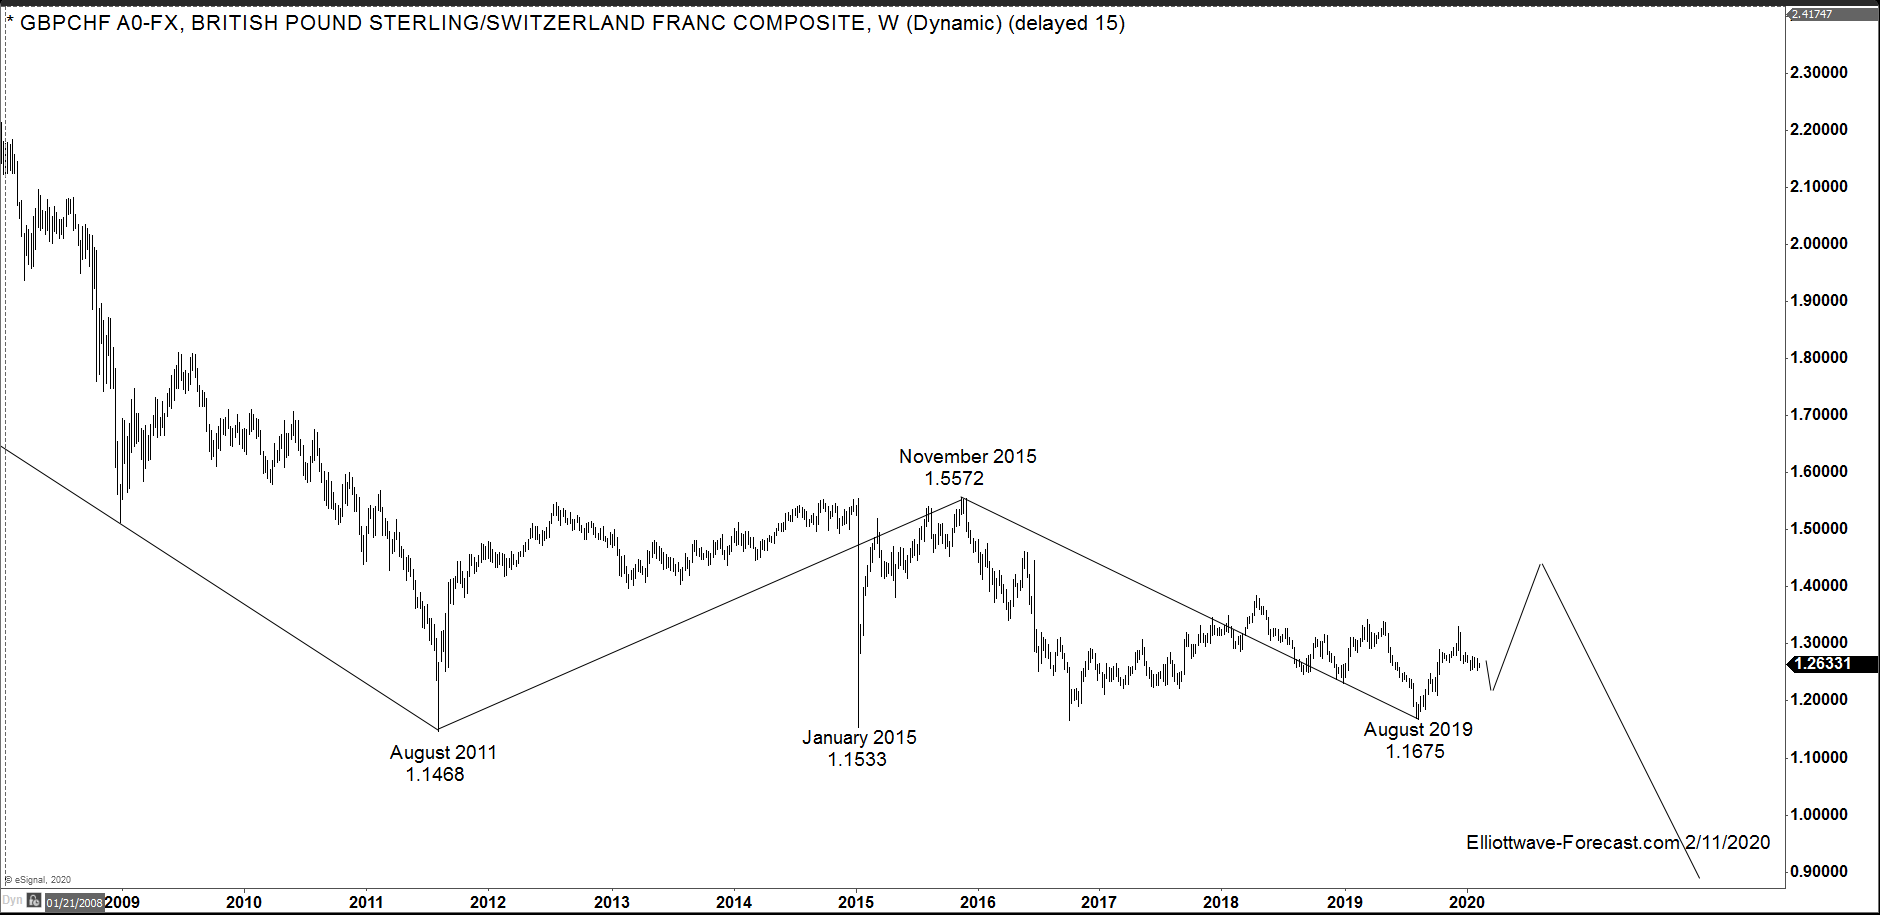
Thirdly and in conclusion. The bounce from the August 2011 low ended at the November 2015 highs in three swings again. The pair declined from there in 3 swings again to the August 2019 lows. The bounce from there was strong enough to suggest it was correcting the cycle from the November 2015 highs. The pair can see a relatively short term decline toward the 1.2185-1.2024 area. Importantly while it remains above the August 2019 lows the pair can see another swing higher toward 1.4000-1.4200. It can see new lows later presuming the November 2015 highs don’t give way in the momentum indicators or price. I would later expect to see the pair make new lows under the August 2011 lows.