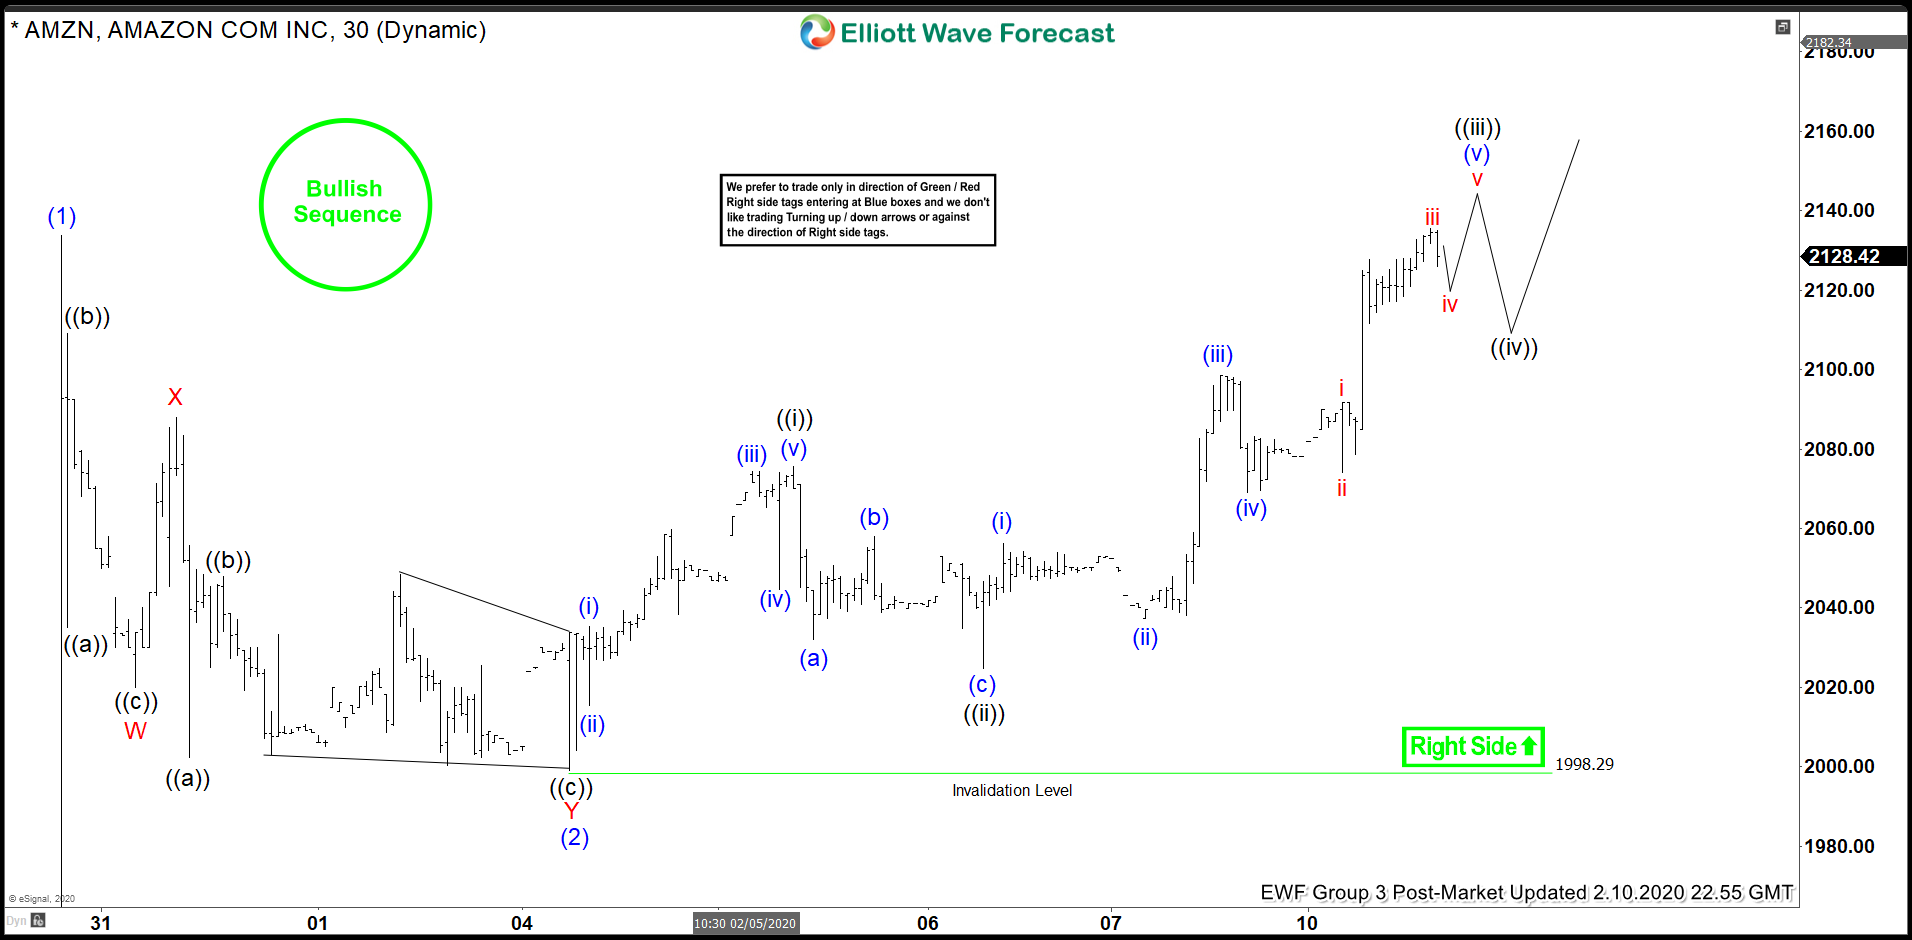
Amazon (ticker symbol: AMZN) broke above July 11, 2019 high (2035.8) a few weeks ago after reporting strong earnings. The stock now shows an incomplete bullish sequence from December 24, 2018 low favoring further upside. In the short term chart below, the rally to 2133.74 ended wave (1) and the pullback to 1998.29 ended wave (2). The internal of wave (2) pullback unfolded as a double three Elliott Wave structure. Wave W of (2) ended at 2020, wave X of (2) ended at 2088, and wave Y of (2) ended at 1998.29.
The stock has resumed higher in wave (3) and broken above wave (1). Wave (3) is unfolding as a 5 waves impulse Elliott Wave structure. Up from wave (2) low , wave ((i)) ended at 2075.5 and wave ((ii)) pullback ended at 2024.80. Wave ((iii)) remains in progress and pullback in wave ((iv)) should find support in 3, 7, or 11 swing. Afterwards, the stock can extend 1 more leg higher to end wave ((v)) of 1. It should then pullback in larger degree within wave 2 to correct cycle from February 4, 2020 low (1998.29) before it resumes higher again. We continue to favor the upside in Amazon. As far as pivot at 1998.29 low stays intact, expect the stock to find buyers in 3, 7, or 11 swing for more upside.
Amazon 1 Hour Elliott Wave Chart