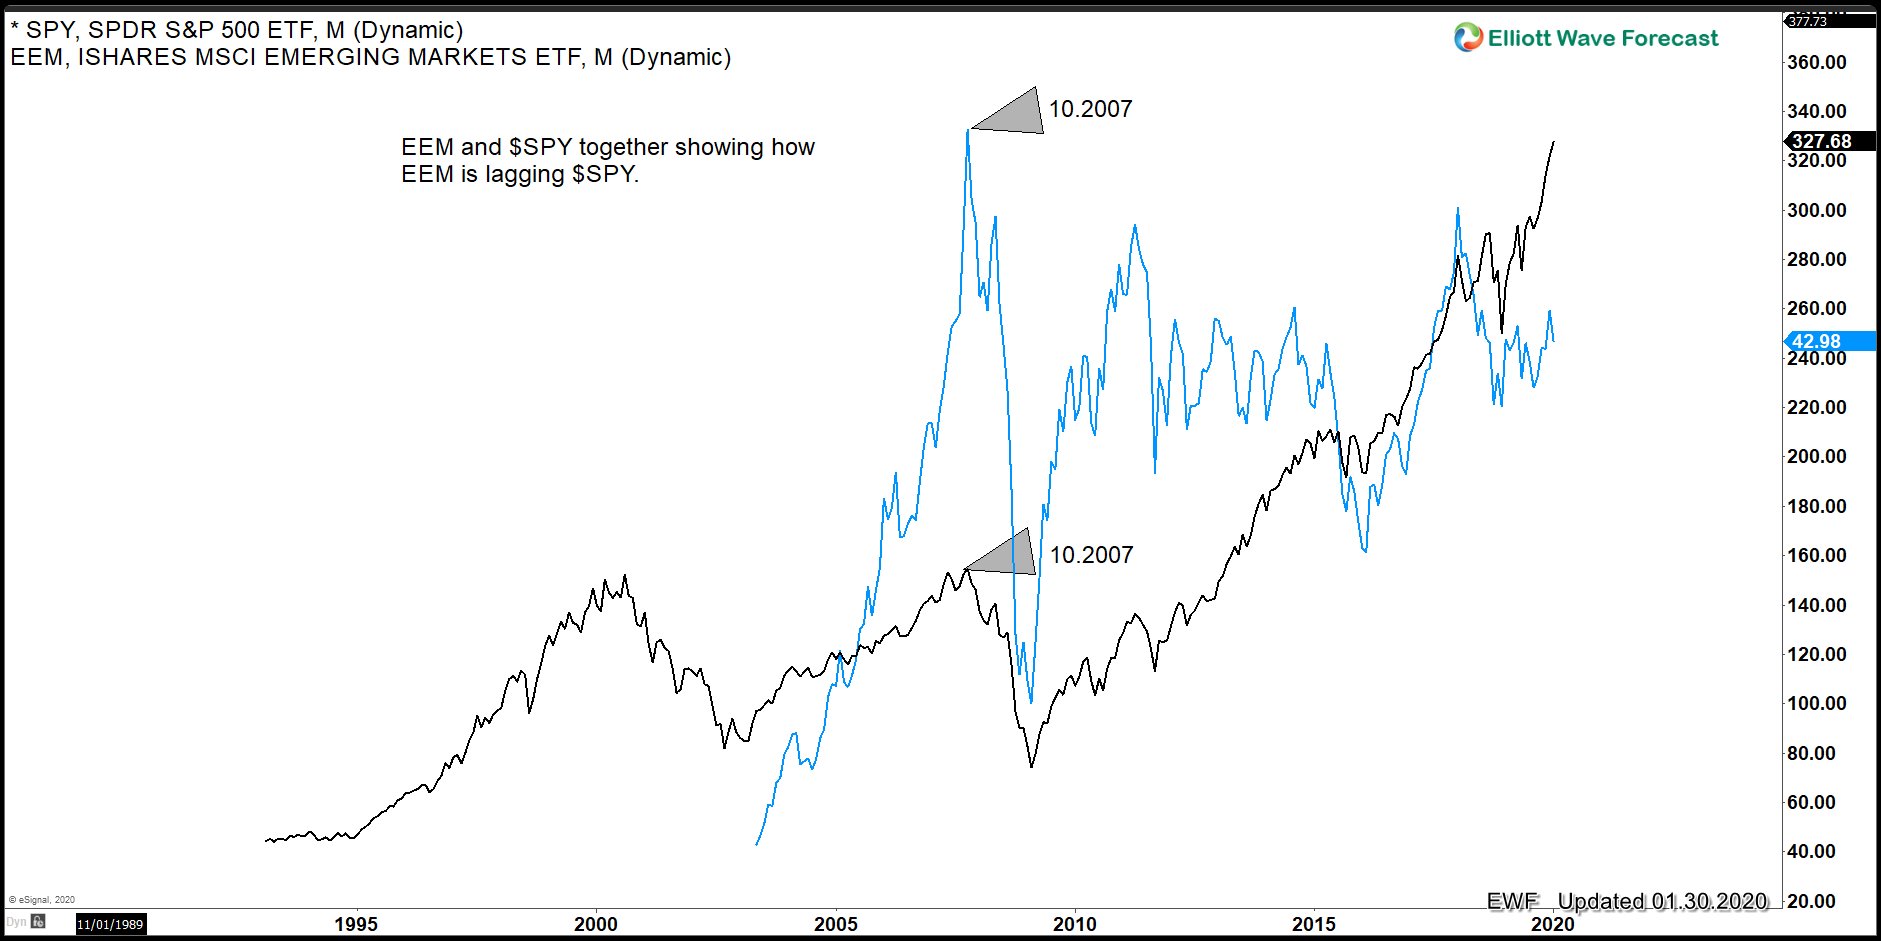
The Emerging Market (EEM) trade within the same cycles as World Indices. However, when comparing it to Indices like $SPY and $SPX, EEM lag behind after it bottomed in 11.2008. Looking at the Grand Super Cycle price action, EEM peaked in 10.2007 then dropped hard along with other Indices. It bottomed in 11.2008 and since then it has rallied in three big waves. Many World Indices have already traded above the 10.2007, but EEM is lagging. In the chart overlay below, EEM is in blue color while SPY is in black color. We can see how $SPY already broke above the peak in 10.2007, but EEM is still trading below the peak.
As we can see fro the blue line above, the reaction higher in EEM is only in three waves. However, World Indices should still see more upside within the 2009 Super Cycle degree, and this leads us believe that EEM can break the 2018 peak and creates a leading diagonal from 11.2008 low. A Leading Diagonal is a sequence of 5-3-5-3-5, which most of the time happens in wave I of a new cycle. The Following chart illustrates the leading diagonal idea:
Emerging Market Monthly Elliott Wave Outlook
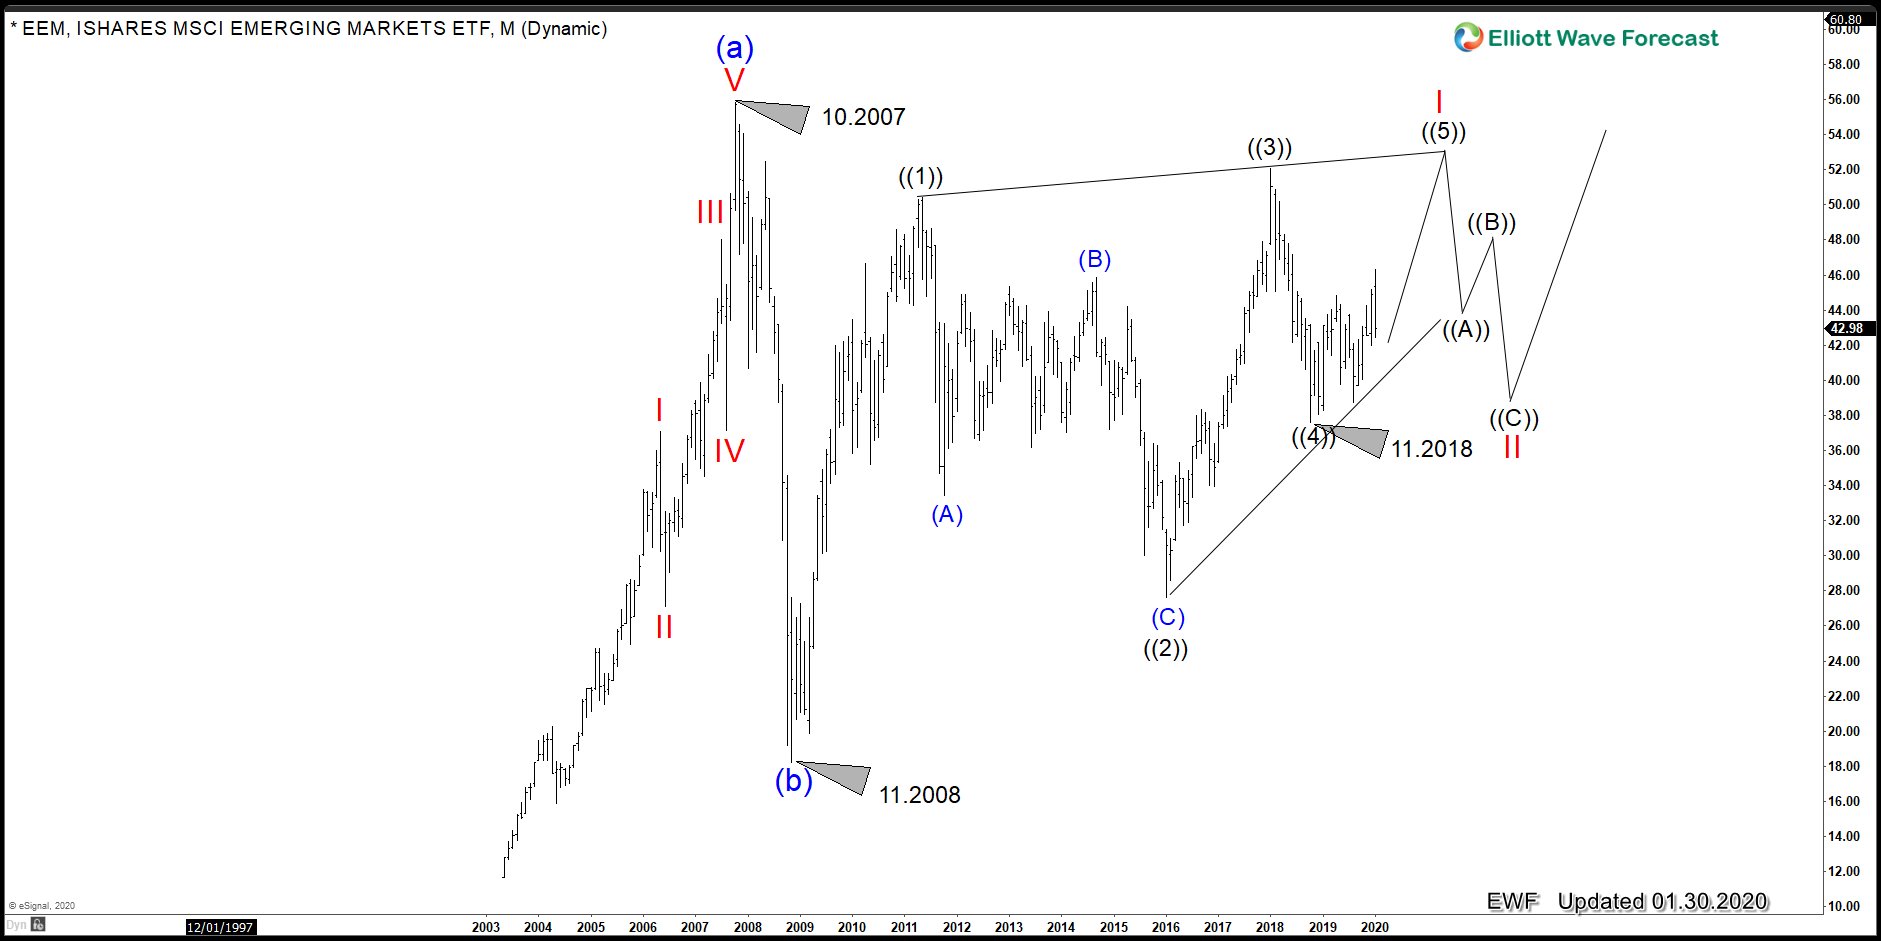
The chart above shows an advance within the Grand Super Cycle, ending five waves into a peak at 10.2007. The Index then ended the Grand Super Cycle correction wave (b) in 11.2008. From the 2008 lows, the leading diagonal is in progress. We expect that when Indices like $SPY ends wave (III), EEM will end Red wave I Red. Then the world indices will pullback in wave (IV), and EEM will correct in red wave II. This will be an interesting scenario where buyers will be entering into the the powerful wave III. The Alternative view is that 11.2008 low is only wave a, then the three waves rally since 11.2008 is wave b. In this case, a strong selling will be taking place into a Buy.
Emerging Market Weekly Elliott Wave Chart
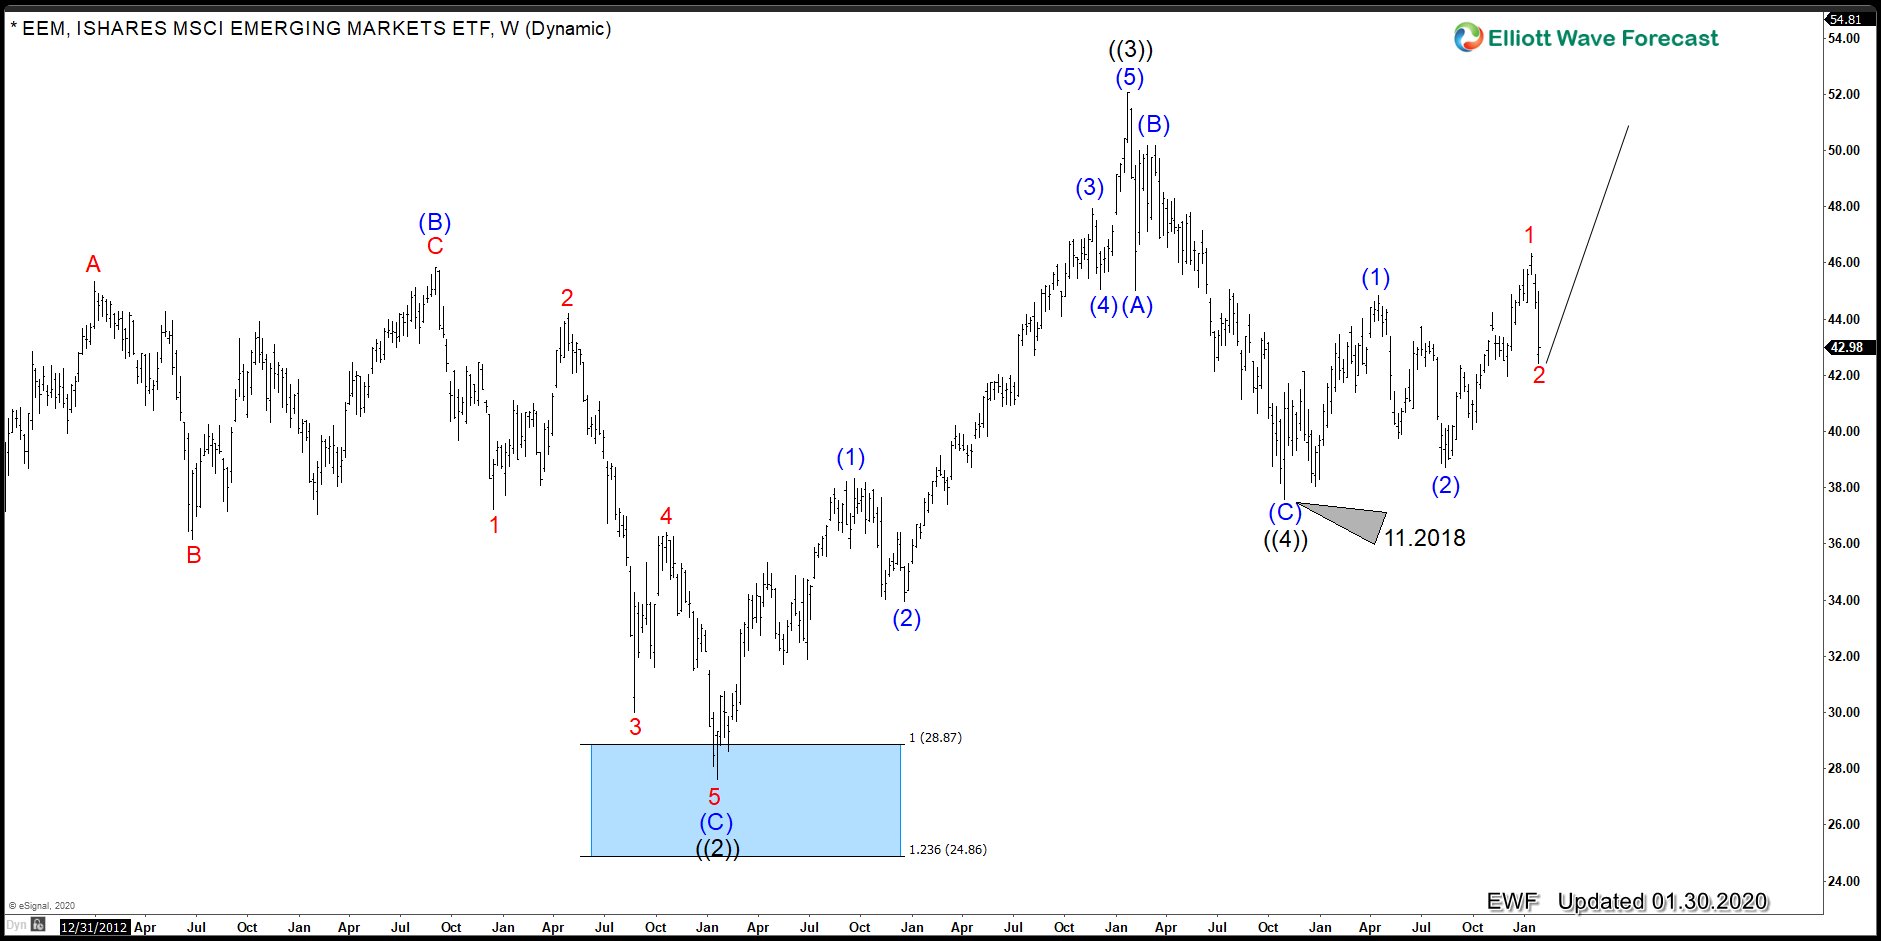
The above chart is the weekly view, which shows the proposed wave ((3)) since the Blue Box at wave ((2). However, the reaction since 11.2018 low is the key as many World Indices extend and make new highs. The reaction in EEM however are only three waves. We label this three waves like a nest because of the stage in World Indices. There is no question EEM’s price action might be corrective, but as far as the 11.2018 low is in place, the above view can happen. There is nothing that indicates a top in World Indices yet, so bulls are still in control in EEM for now.