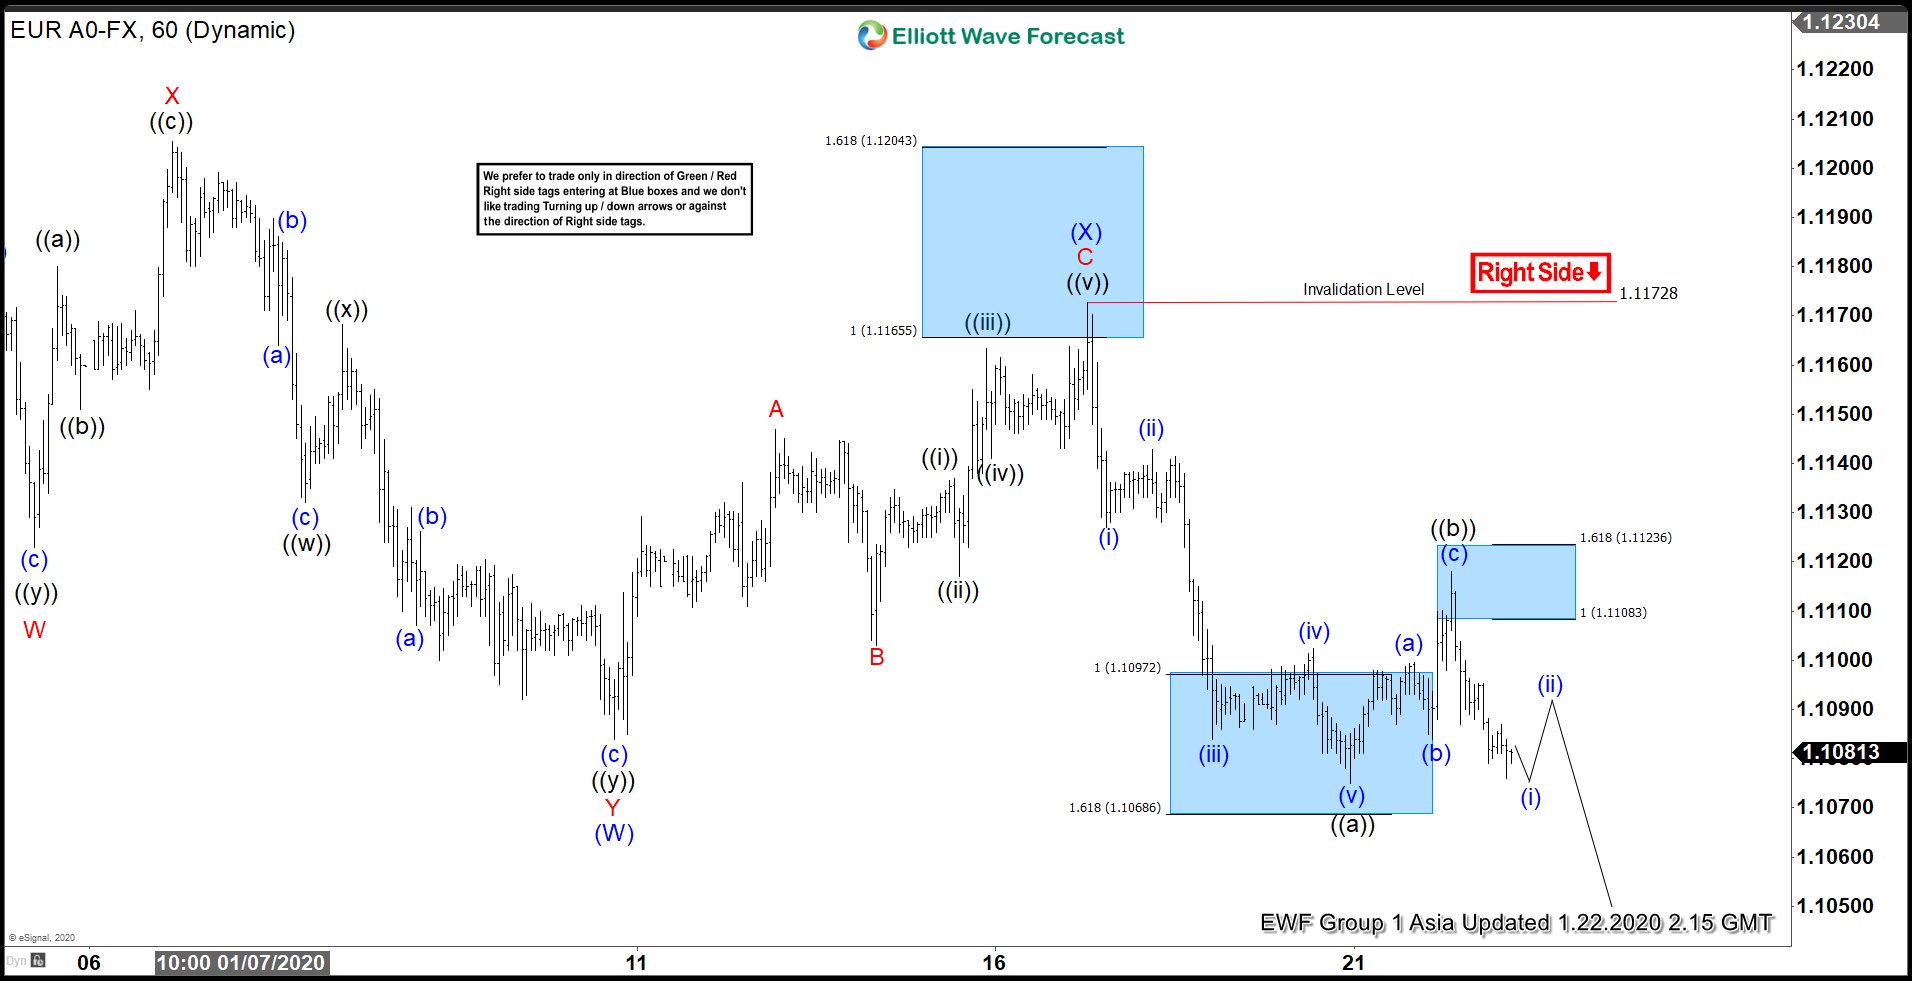
EURUSD short term Elliott Wave view suggests the decline from 1.6.2020 high is unfolding as a double three Elliott Wave structure. Down from January 6 high, wave ((w)) ended at 1.1132 and bounce in wave ((x)) ended at 1.1168. Pair extended the decline to 1.1084 which ended wave ((y)). This decline also ended wave (W) in larger degree. Pair then bounced as a zigzag within wave (X). Wave A of (X) ended at 1.1147, wave B of (X) ended at 1.1103, and wave C of (X) ended at 1.117.
After ending wave (X), pair resumed lower and it has broken below wave (W) at 1.1084. Pair now shows incomplete sequence from 1.6.2020 high suggesting further downside is likely. Down from wave (X) high at 1.117, wave ((a)) ended at 1.1075 as a 5 waves impulse and wave ((b)) bounce ended at 1.1118. Near term, while bounce stays below 1.117, expect pair to extend lower. Rally thus should see sellers in the sequence of 3, 7, or 11 swing as far as pivot at 1.117 high stays intact. Potential target lower is 100 – 123.6% Fibonacci extension from 1.6.2020 high which comes at 1.102 – 1.105.
EURUSD 1 Hour Elliott Wave Chart