

The rally from June lacks impulsive strength and ends after only three waves higher. This three‑wave structure signals a corrective move, not the start of a sustained bullish trend. Therefore, the advance fits as part of a larger double‑correction pattern still pointing lower.
Moreover, the incomplete downside structure suggests Ford may resume weakness once the connector finishes. The market offered temporary strength, yet that strength aligns with a corrective bounce inside a broader bearish sequence. Consequently, expect renewed downside pressure as the double correction unfolds.
Elliott Wave Outlook: Ford (F) Weekly Chart March 2026
In March, we expect Ford to stay inside a corrective structure that began months earlier. Wave B failed to break the wave (X) high and stalled near 14.80, which confirmed the rally was corrective. After that, price turned sharply lower, keeping the broader bearish sequence intact and signaling that wave C should develop next.
Furthermore, we anticipate an impulsive decline toward the blue‑box area at 8.28–4.26. Buyers typically return in this zone, and that reaction should complete the entire wave II correction. Once this support triggers, Ford should set the stage for a new rally into the next cycle.
(If you want to learn more about Elliott Wave Principle, please follow these links: Elliott Wave Education and Elliott Wave Theory.)
Elliott Wave Principle Behind the Market Structure
Impulse
An impulse is a clean 5‑wave pattern that drives the trend forward.
- Waves 1‑3‑5 are strong and directional.
- No overlap between waves 1 and 4.
- Wave 3 is usually the strongest.
- Structure is clear, with increasing momentum
Elliott Wave Outlook: Ford (F) Weekly Chart July 2026
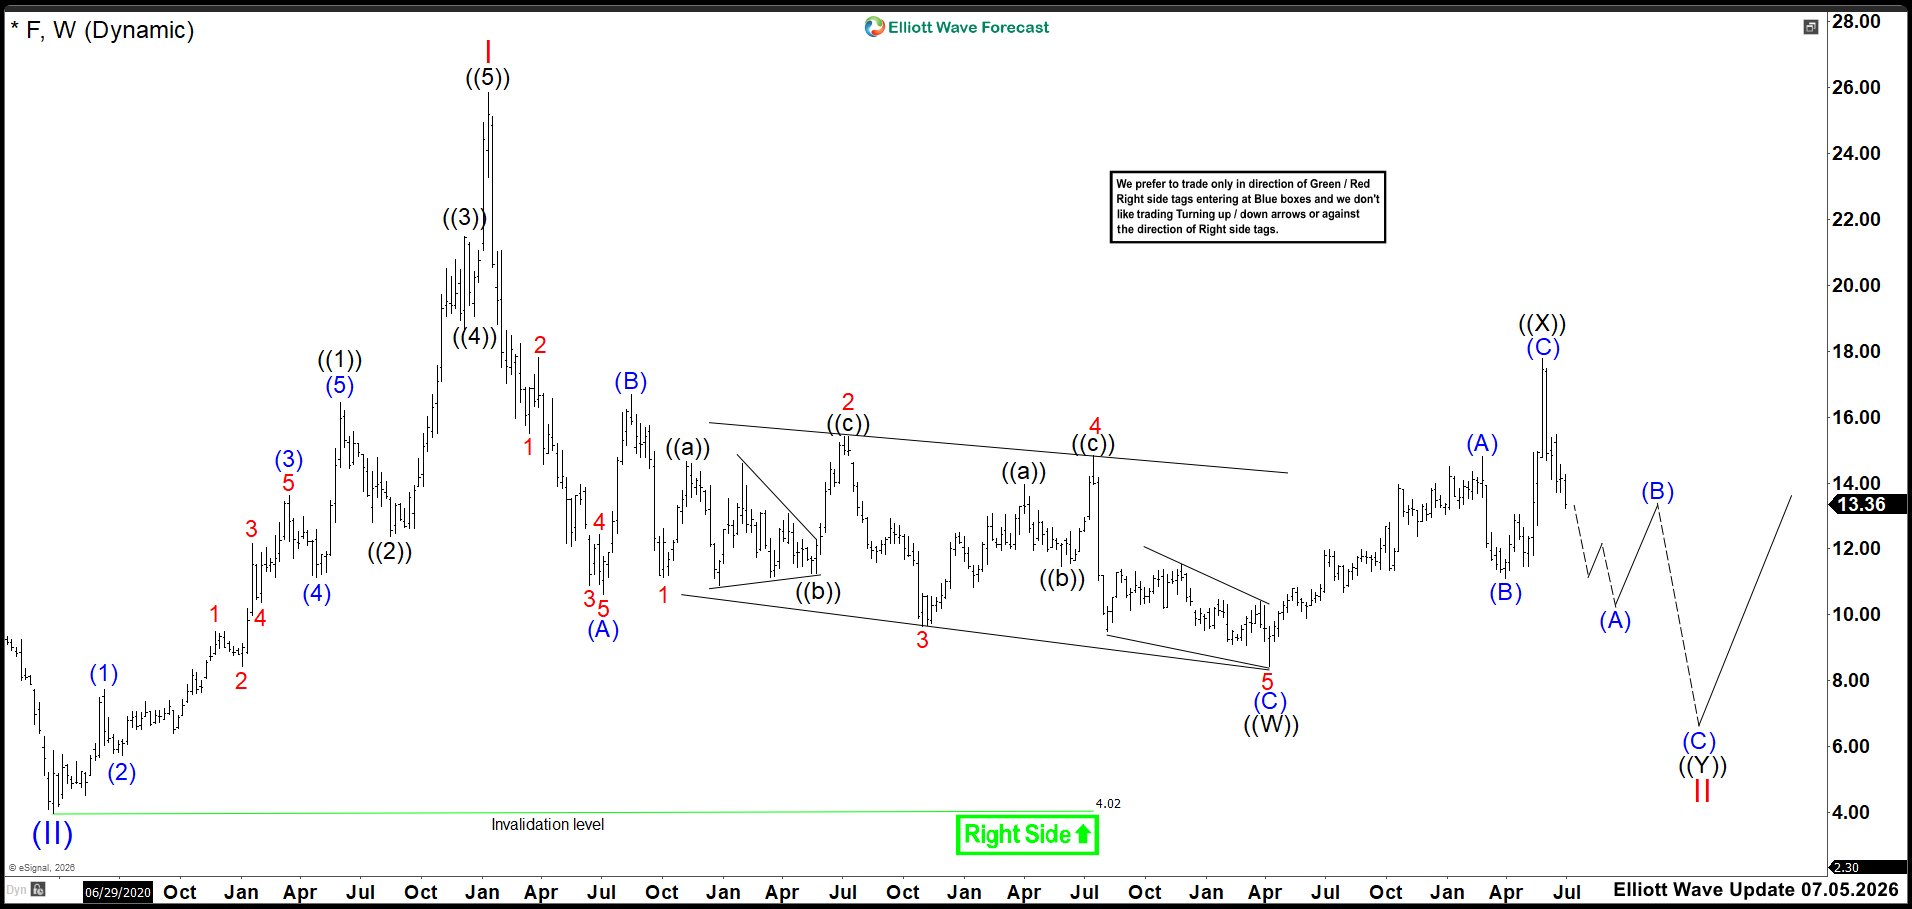
The market broke above wave B, which initially suggested a possible bottom. However, we still see only three waves higher, keeping the bearish sequence active and confirming that downside pressure remains dominant.
Moreover, we need an impulse or a leading diagonal from the lows to change the trend. For now, this rebound fits as wave ((X)), and we are building wave ((Y)) of II. This setup implies three more waves lower aiming to break 8.43 before completing the structure.
Source: https://elliottwave-forecast.com/stock-market/ford-f-broke-higher-target-remains-unchanged/