Boeing is all over the news today with the firing of C.E.O Dennis Muilenburg. As we always do at elliottwave-forecast.com, we placed a lot of attention to the Technical path. We use a complex system that includes Cycles, Sequences, Distribution, correlations, and The Elliott wave System to come out with the highest probability forecast. The company has been mired in the worst crisis in its 103-year history since the crashes of two 737 Max jets killed 346 people.
The plane has been ground since March and Boeing has faced cascading delays as it tries to return the Max to the air. We were able to forecast this crisis early this year, explained in this previous blog. The instrument has been sideways and giving lower low and lower high since the peak, but also showing five swings since the peak in 9.25.2019 and should remain trading to the downside for the months to come. The following chart:
Boeing Weekly Elliott Wave Chart 12/23/2019
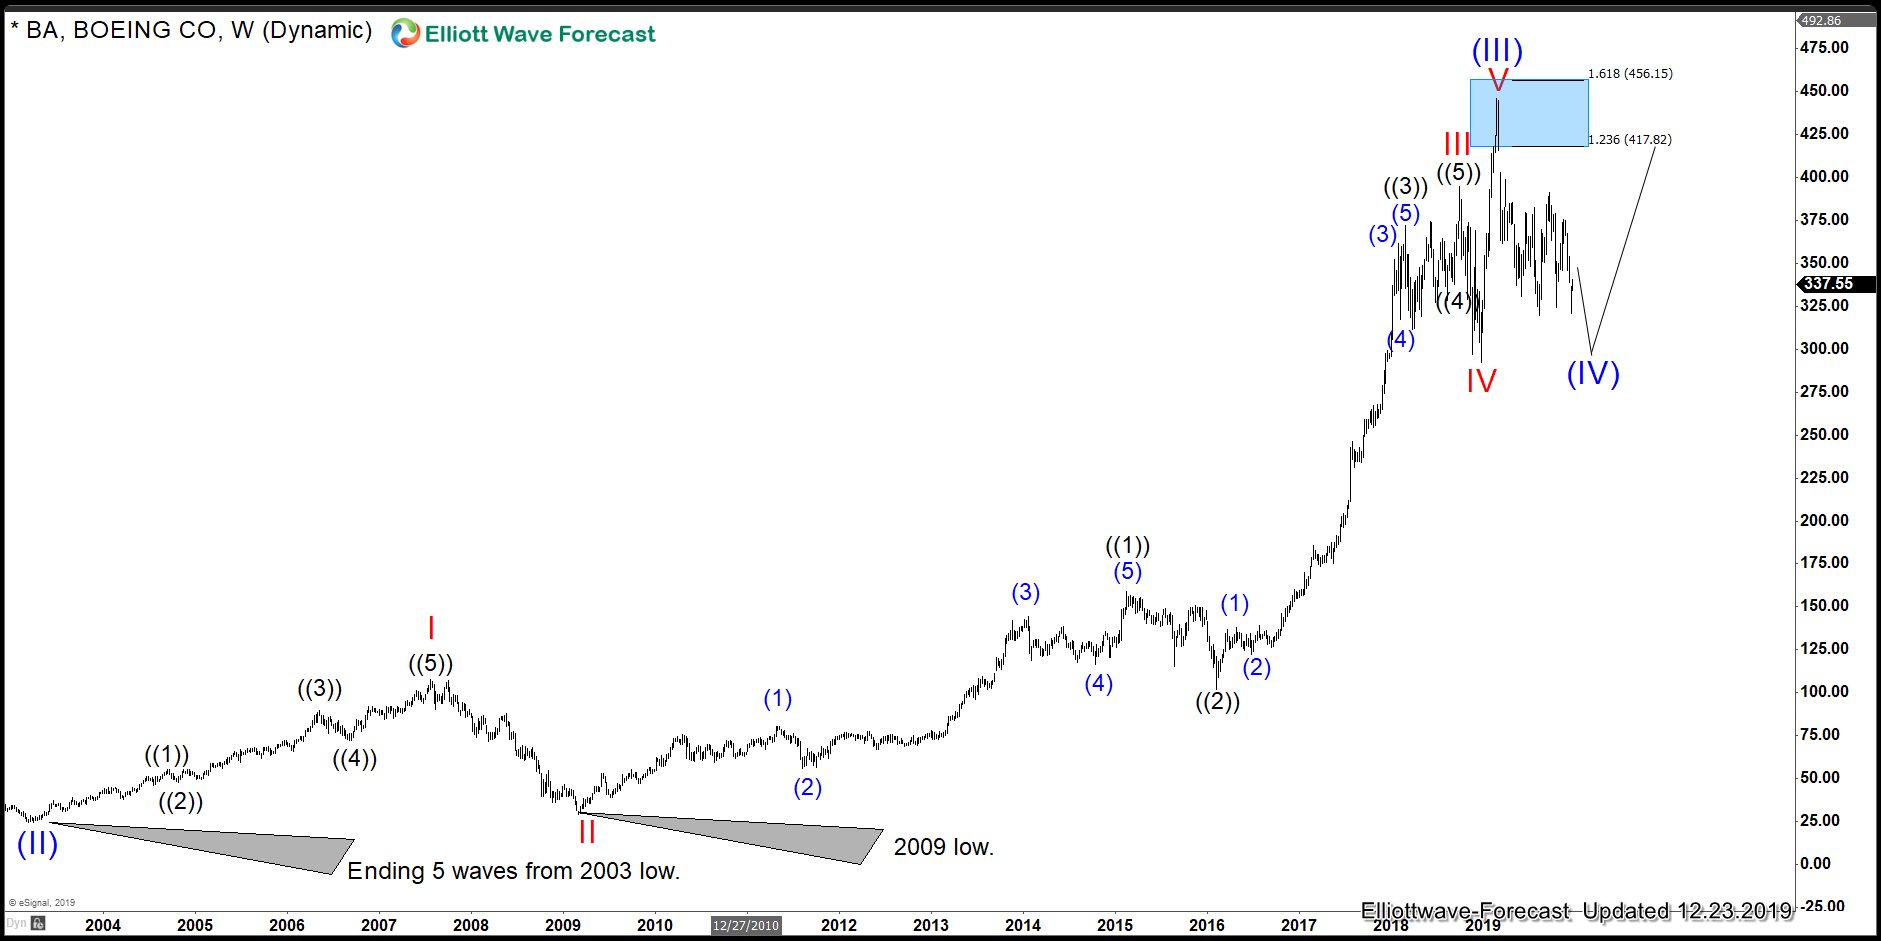
Shows that the Grand Super degree cycle and the most aggressive view is that we are trading within a wave (IV) in blue, and next year, we should be seeing new highs again and a big three-wave pullback. Many World Indices are ending 2009, and that opens the door for Boeing to have already finished the cycle and consequently, also, now completing the first leg of the most significant seven big waves lower. Either way, the 4 Hour path is very clear, and it is calling for more downside into the $275.00 target; their buyers will be waiting for either of the two possibilities presented above. The following chart:
Boeing Daily Elliott Wave Chart 12/23/2019
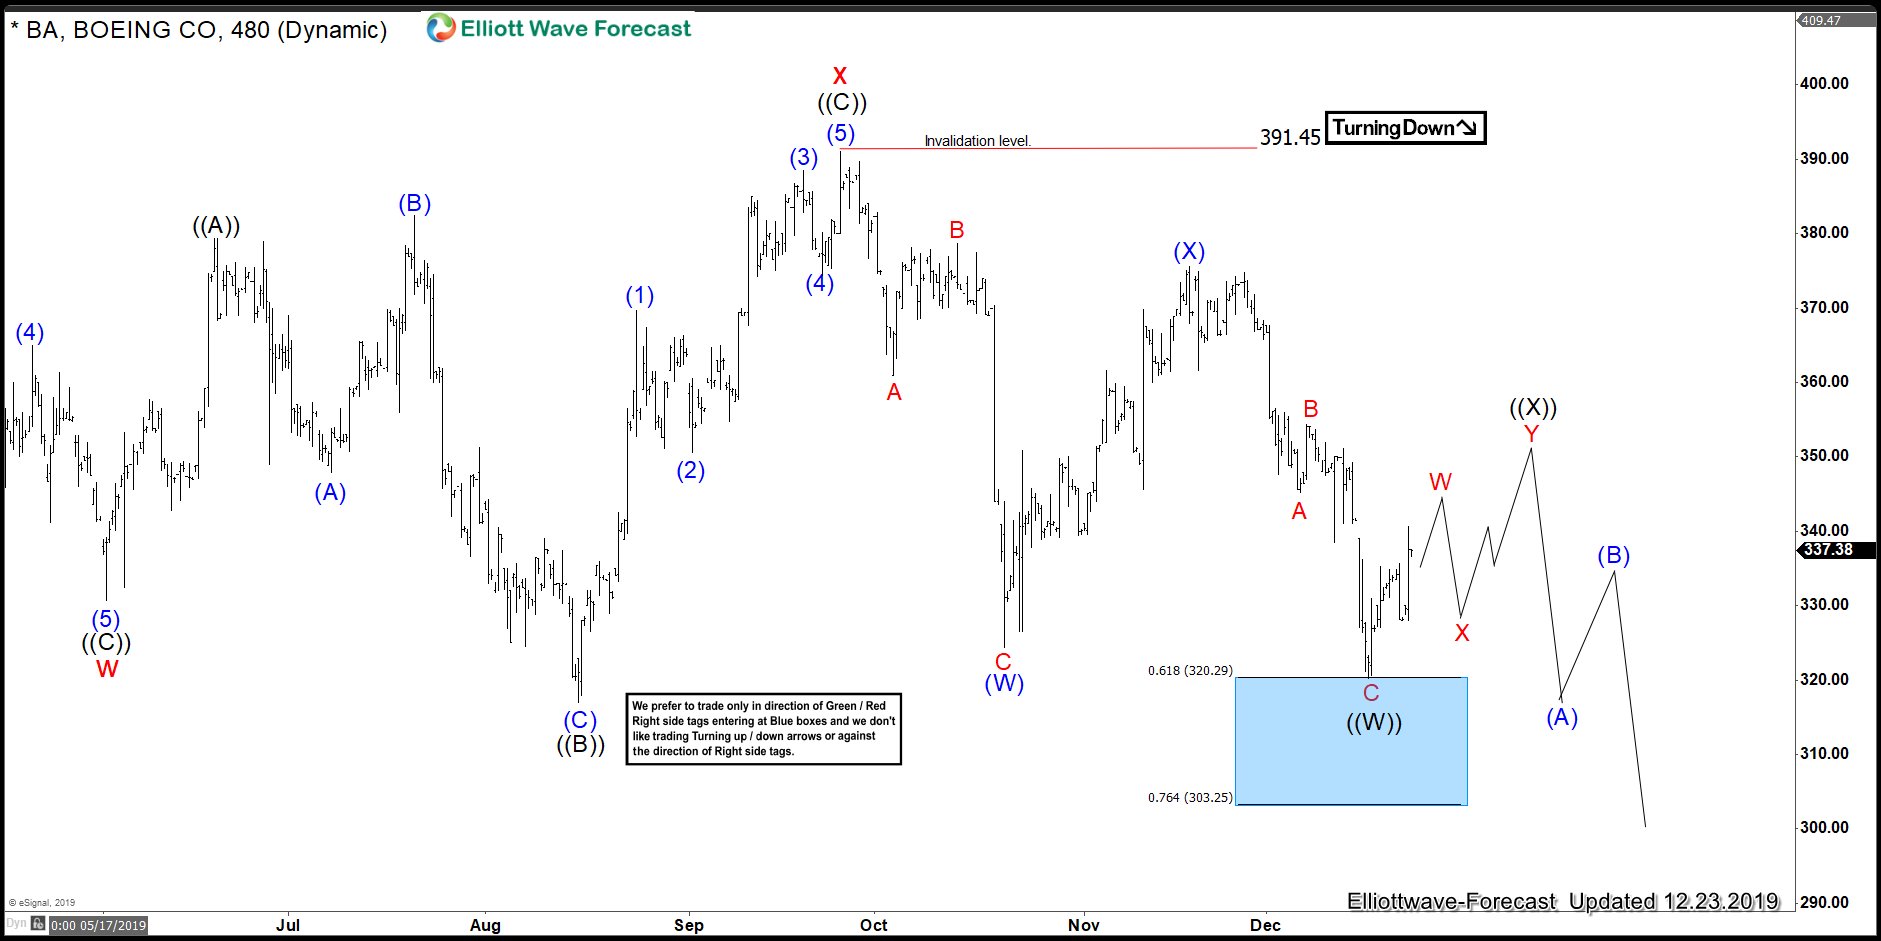
Shows the 4 Hour path, and how this bounce is coming from our Blue Box area between $320.29-303.25. We expect this bounce to remain below $391.45, and turn lower into the target. Boeing is part of the World Trading, and we hope everyone agrees with us that the company will not go anywhere, but we need to understand that Market trade, as a whole, and last week $ S.P.X. Finally took the $3189 level, which makes the Grand Supercycle an impulse like shown in the following chart:
Boeing Quarterly Elliott Wave Chart 12/23/2019
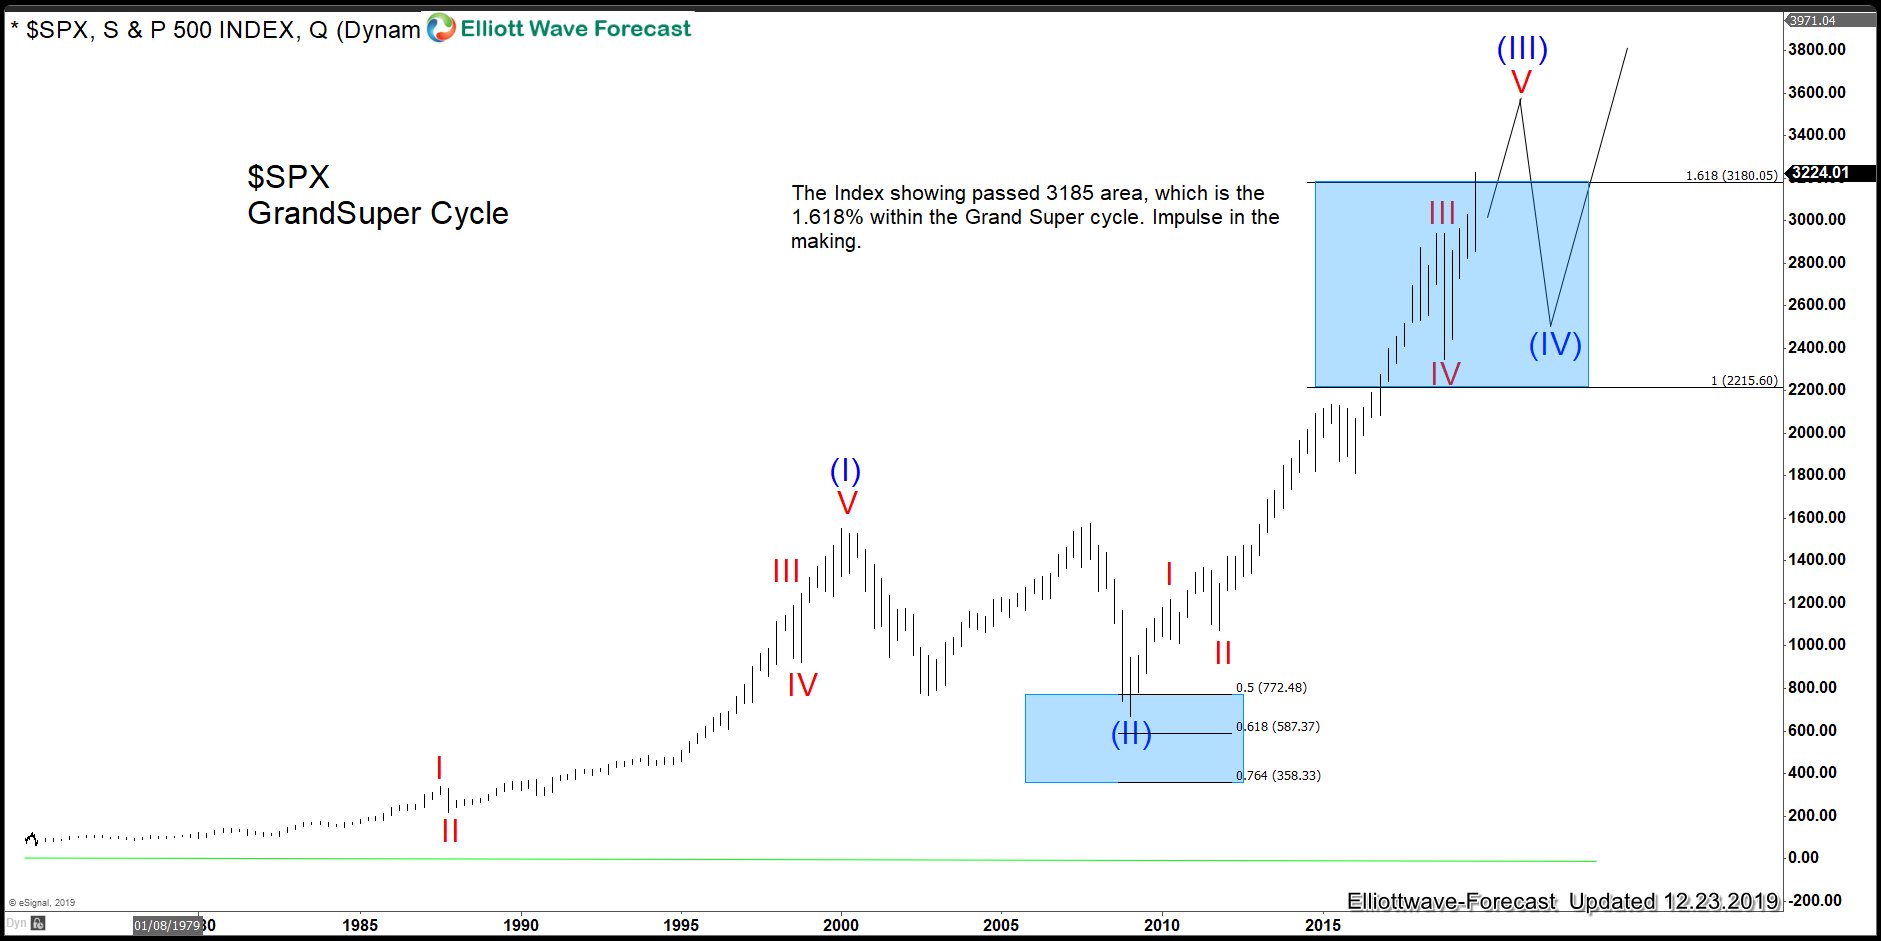
The break represents positive support for Boeing, but we need to understand that a wave (IV) is soon to happen in the Index, which will negatively affect Boeing, the same way. The following chart:
Boeing Weekly Elliott Wave Overlay Chart
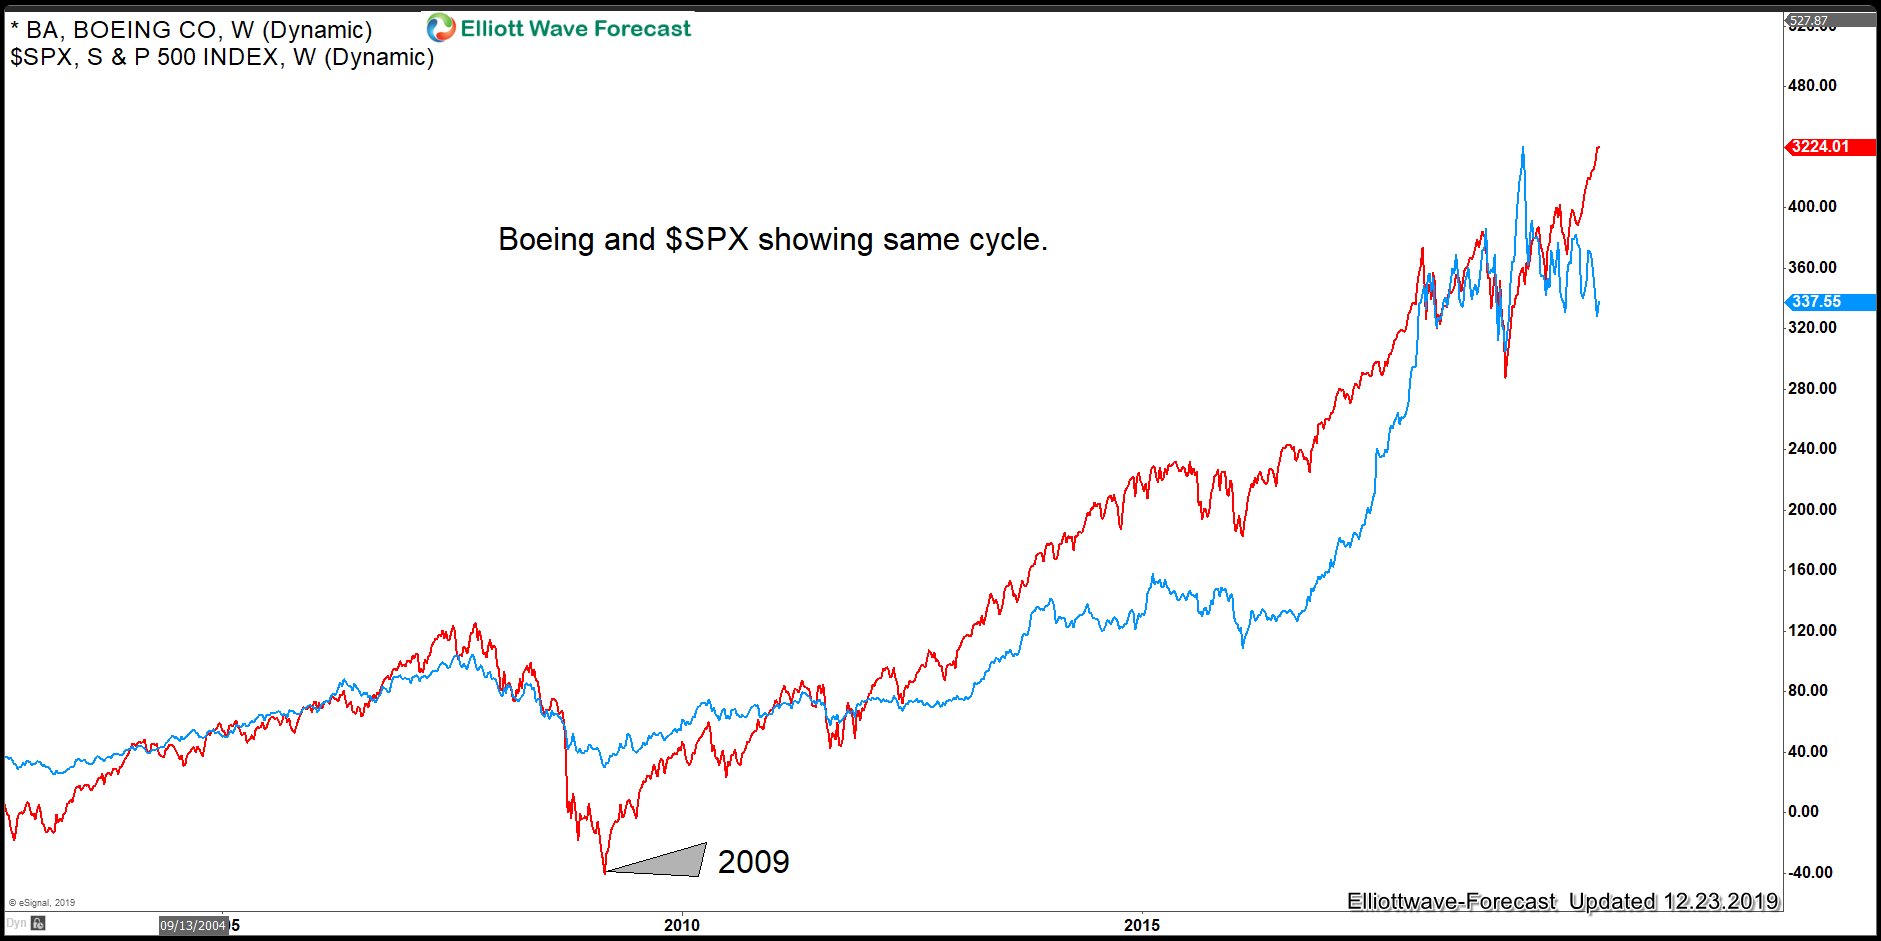
Here’s an overlay of Boeing and $ S.P.X., showing the cycles and Elliott wave labels. Knowing and relating all these instruments across the world is key because it all depends on the levels and timing. One thing is clear. World Indices remain a buy in the dips, but a period of choppiness, the biggest since 2009 will make many Stocks and ETFs also to trade lower or sideways. Boeing’s new C.E.O. will see the light at the end of the tunnel but will have a period of turbulence on the horizon, not only because the company is dealing with the crisis of the 737 Max Jets, but because of the timing of the World Indices.