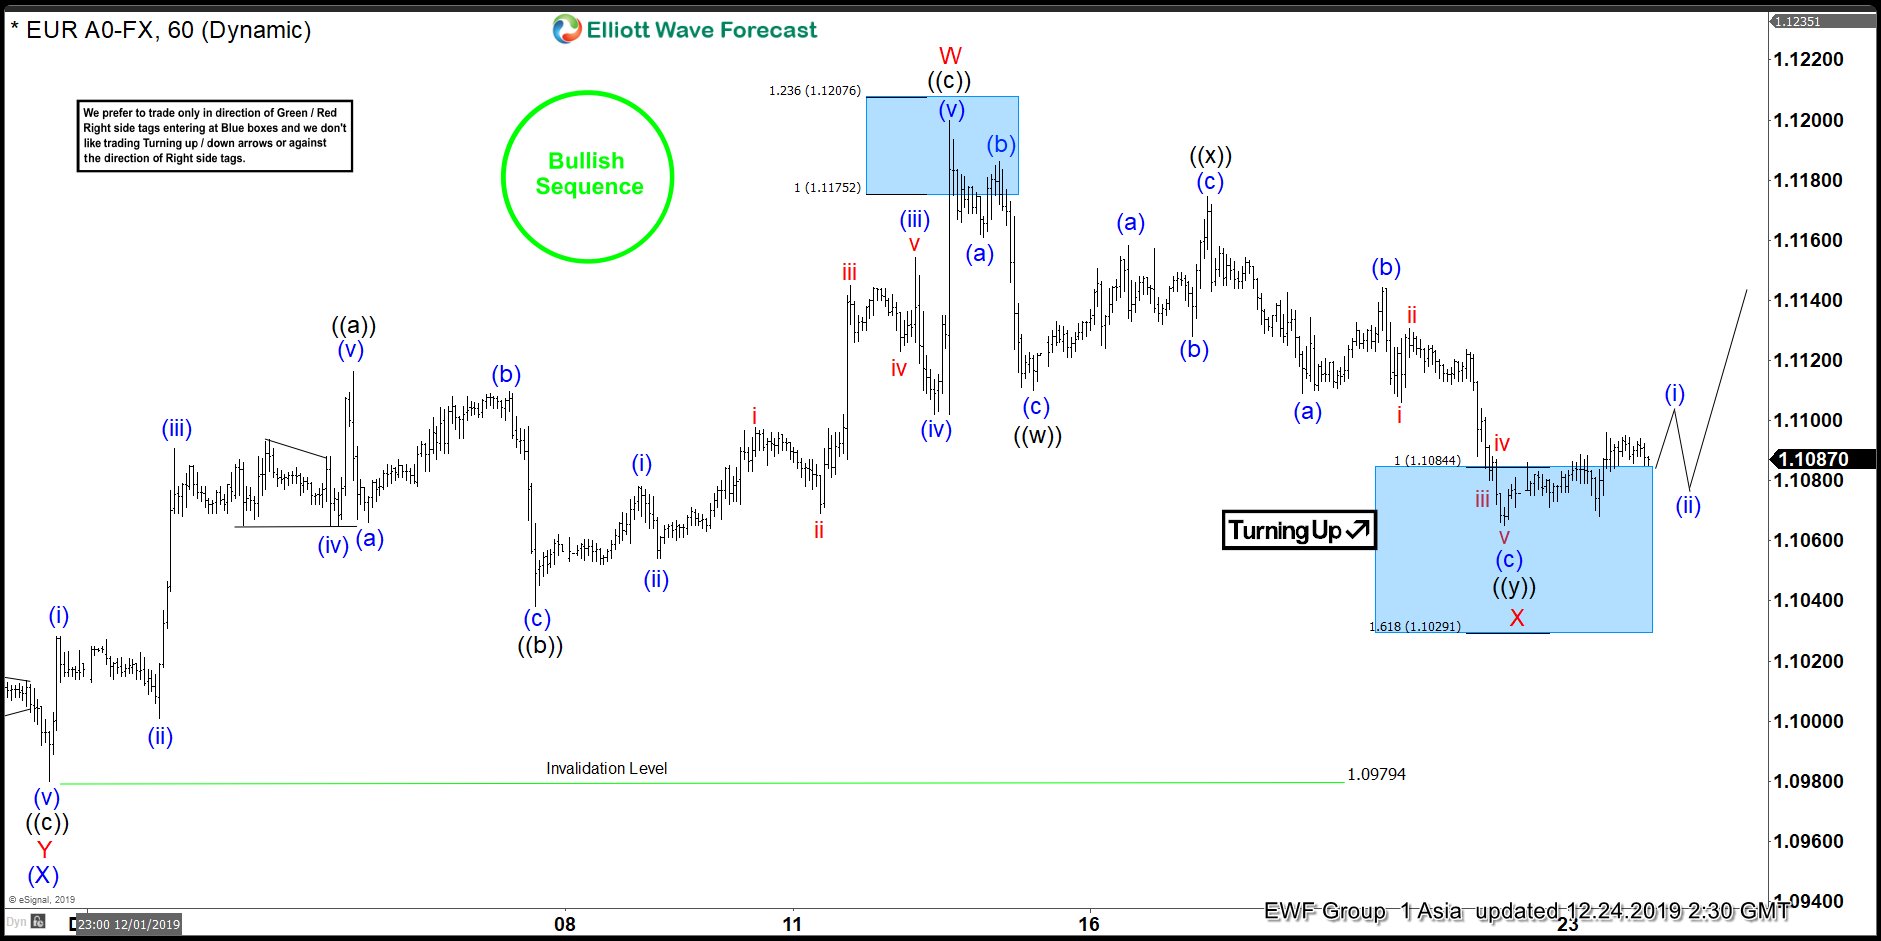
Short-term Elliott wave view in EURUSD suggests that the main cycle from October 01, 2019 low is showing 5 swings corrective sequence favoring more upside to take place towards $1.1286-$1.1358 area next before a recovery could end. Also, it’s important to note that the pair is showing a bullish sequence tag favoring more upside to take place against $1.0979 low. On the Chart below, a pullback to $1.0979 low ended wave (X) pullback. Up from there, wave W unfolded as Elliott wave zigzag structure where wave ((a)) ended in 5 waves at $1.1116. Down from there, wave ((b)) pullback ended at $1.1038 low.
Above from there, pair made another 5 waves rally in lesser degree cycles & ended wave ((c)) at $1.1199 high. Down from there, the pair made a pullback & corrected the cycle from November 29, 2019 low ( $1.0979). The internals of that pullback unfolded as Elliott wave double three structure where wave ((w)) ended at $1.1110 low. Wave ((x)) bounce ended at $1.1174 high. And wave ((y)) ended at $1.1065 low, after reaching the blue box area i.e 100%-161.8% Fibonacci extension area of ((w))-((x)). Near-term, while dips remain above $1.1065 low and more importantly above $1.0979 low the pair is expected to resume the upside or should do a 3 wave bounce at least. We don’t like selling the pair & expect more upside to take place from the blue box area as far as the pivot from $1.0979 low stays intact.
EURUSD 1 Hour Elliott Wave Chart