
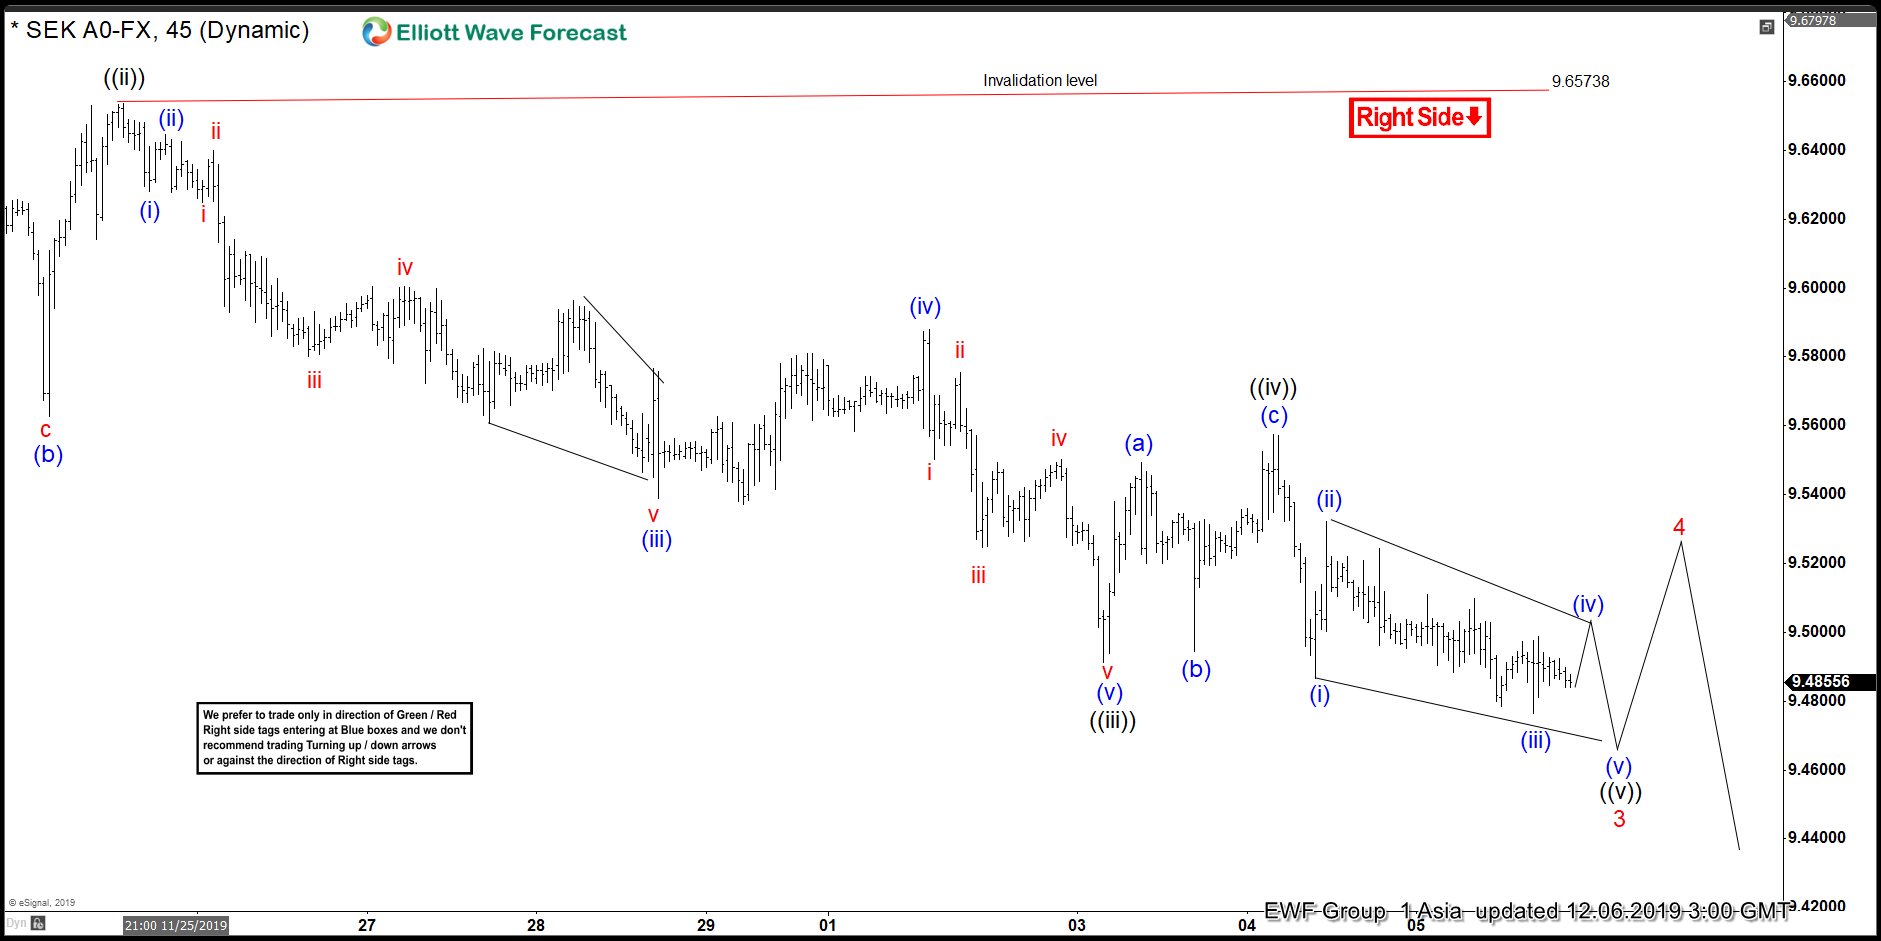
In this blog, we will take a look at the recent price action of USDSEK since we published the short-term view for this pair in Chart of the day on 12.6.2019 Pair was showing an incomplete sequence down from 10.9.2019 (9.964) peak against 11.13.2019 (9.765) and was calling for more downside toward 9.3527 – 9.2549 area. The initial decline from 10.9.2019 (9.964) peak to 10.24.2019 (9.5544) was impulsive so we expected the decline from 11.13.2109 peak also to unfold as an impulse. Let’s take a look at the chart from 12.6.2019 when we showed the pair was close to ending red wave 3.
USDSEK Short-term Elliott Wave Update 12.6.2019
USDSEK Weekend Update 12.8.2019
Chart below shows pair made a new low as expected to complete a diagonal wave ((v)) of red wave 3 and started bouncing. We have already seen a push higher that we labelled as wave ((a)) and pull back in wave ((b)) and now expecting another leg higher in wave ((c)) to complete wave 4 as a zigzag Elliott wave structure.

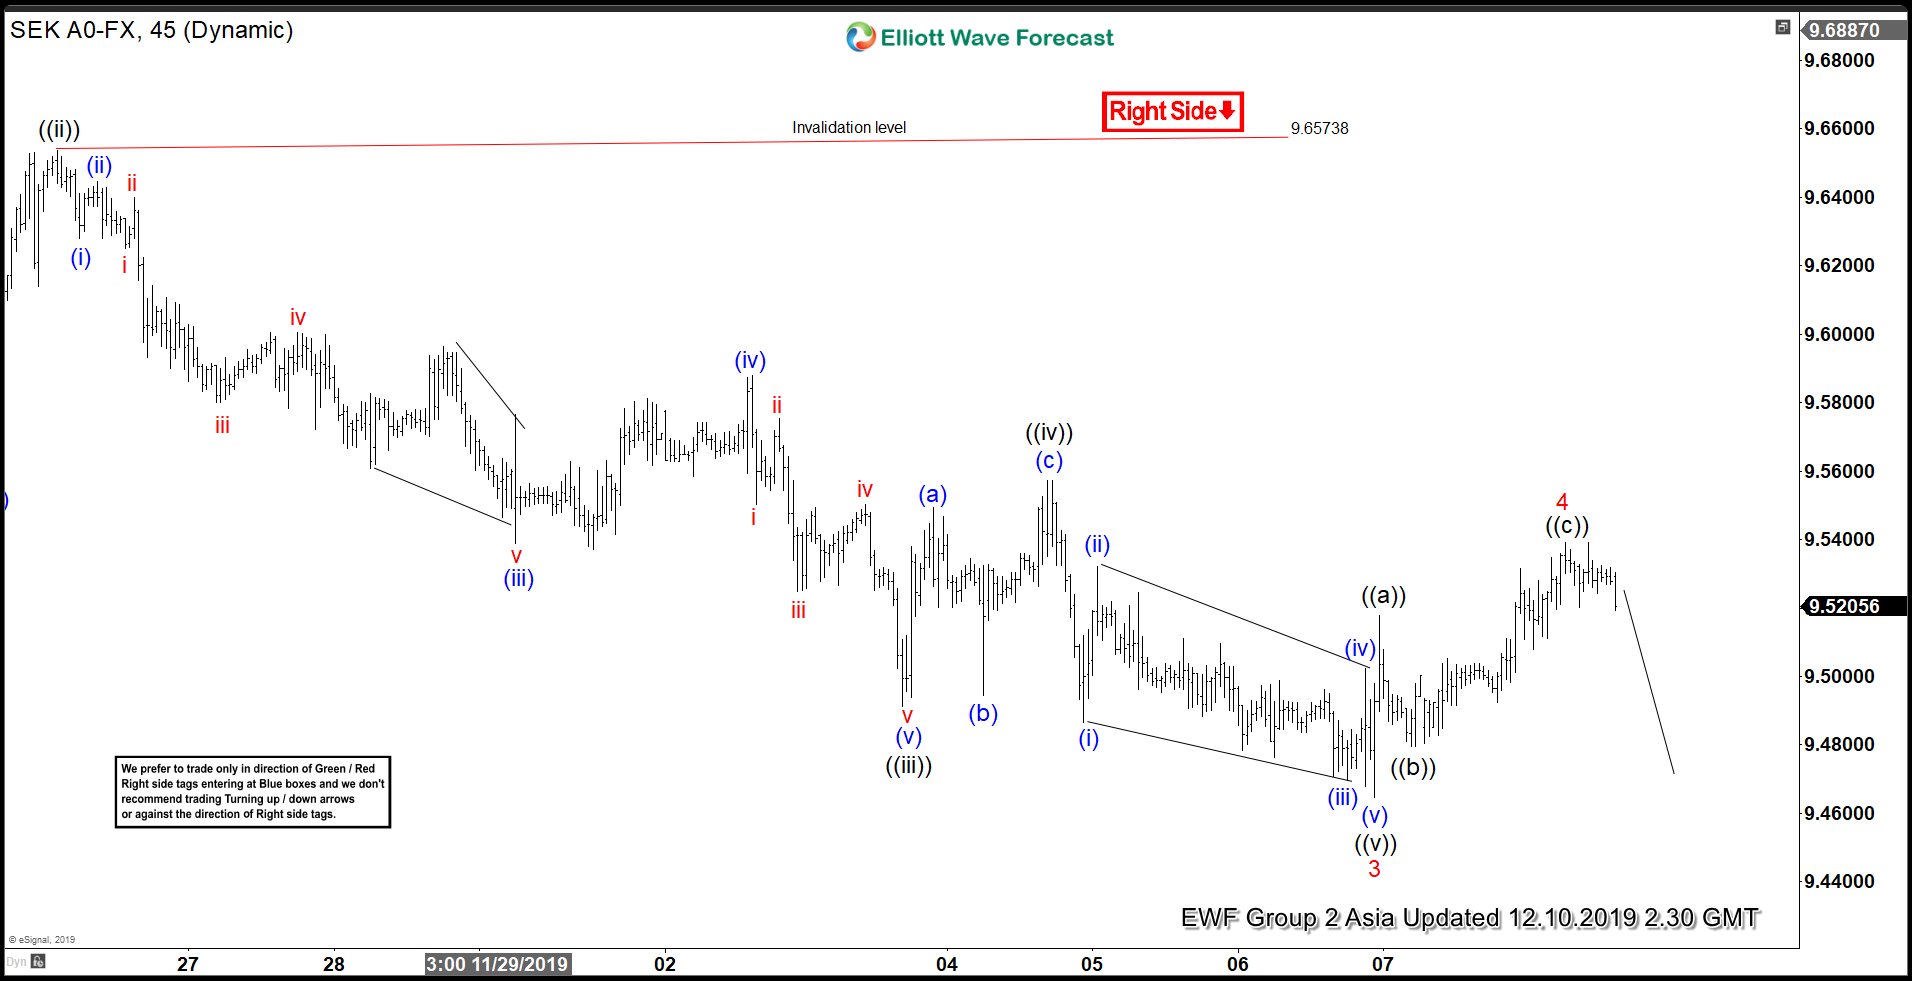
USDSEK Short-term Elliott Wave Update 12.10.2019
USDSEK made the push higher in wave ((c)) and reached 100% Fibonacci extension of ((a))-((b)) and now started to turn lower again. We expected the decline to resume in wave 5 provided price stayed below the red 4 peak. If the pair made a marginal new high, it could still be counted as wave ((c)) and part of red 4.
USDSEK Short-term Elliott Wave Analysis 12.11.2019
Chart below shows pair dropped to new lows below wave 3 low and has started the decline in wave 5 toward 9.3527 – 9.2549. Pair looks to have completed wave (iii) of ((v)) of 5 and expected to make at least 2 more lows to complete 5 waves in wave 5, complete 5 waves decline from 11.13.2019 peak and also complete 3 waves from 10.9.2019 peak.
