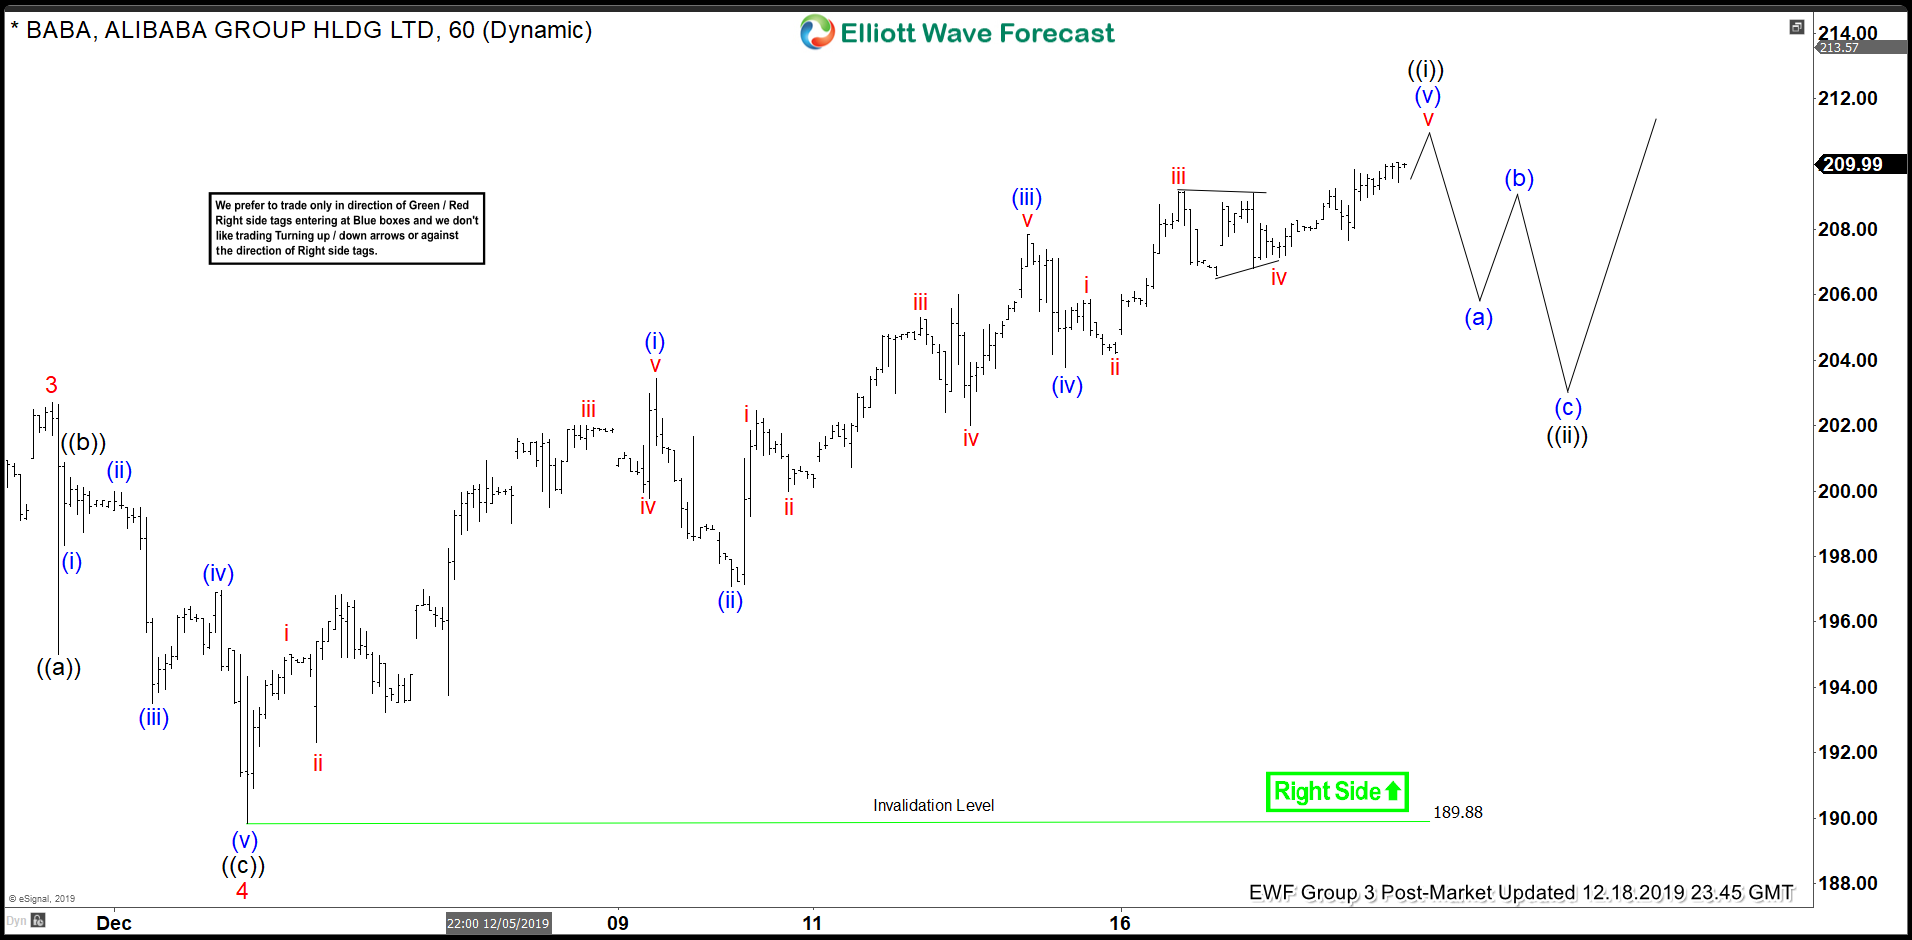
Elliott Wave view in Alibaba ($BABA) suggests that stock rallies as a 5 waves impulsive Elliott Wave structure from August 5, 2019 low. On the 1 hour chart below, we can see wave 3 of this impulse ended at 202.71. Stock then pullback in wave 4 on December 3, 2019 low at 189.88. Stock has resumed higher in wave 5 with the internal subdivision as another impulse in lesser degree. Up from December 3 low, wave (i) ended at 203.43 and pullback in wave (ii) ended at 197.09. Stock then extended higher in wave (iii) towards 207.85 and wave (iv) ended at 203.77.
Stock has scope to extend higher in the near term but expect wave (v) of ((i)) to end soon. It should then pullback in wave ((ii)) to correct the cycle from December 3, 2019 low before the rally resumes. We don’t like selling the proposed pullback and expect buyers to appear in the sequence of 3, 7, or 11 swing as far as pivot at 189.88 low stays intact. Potential target to the upside is 100% – 123.6% Fibonacci extension from January 3, 2019 low which comes at 213 – 229 area.
BABA 1 Hour Elliott Wave Chart