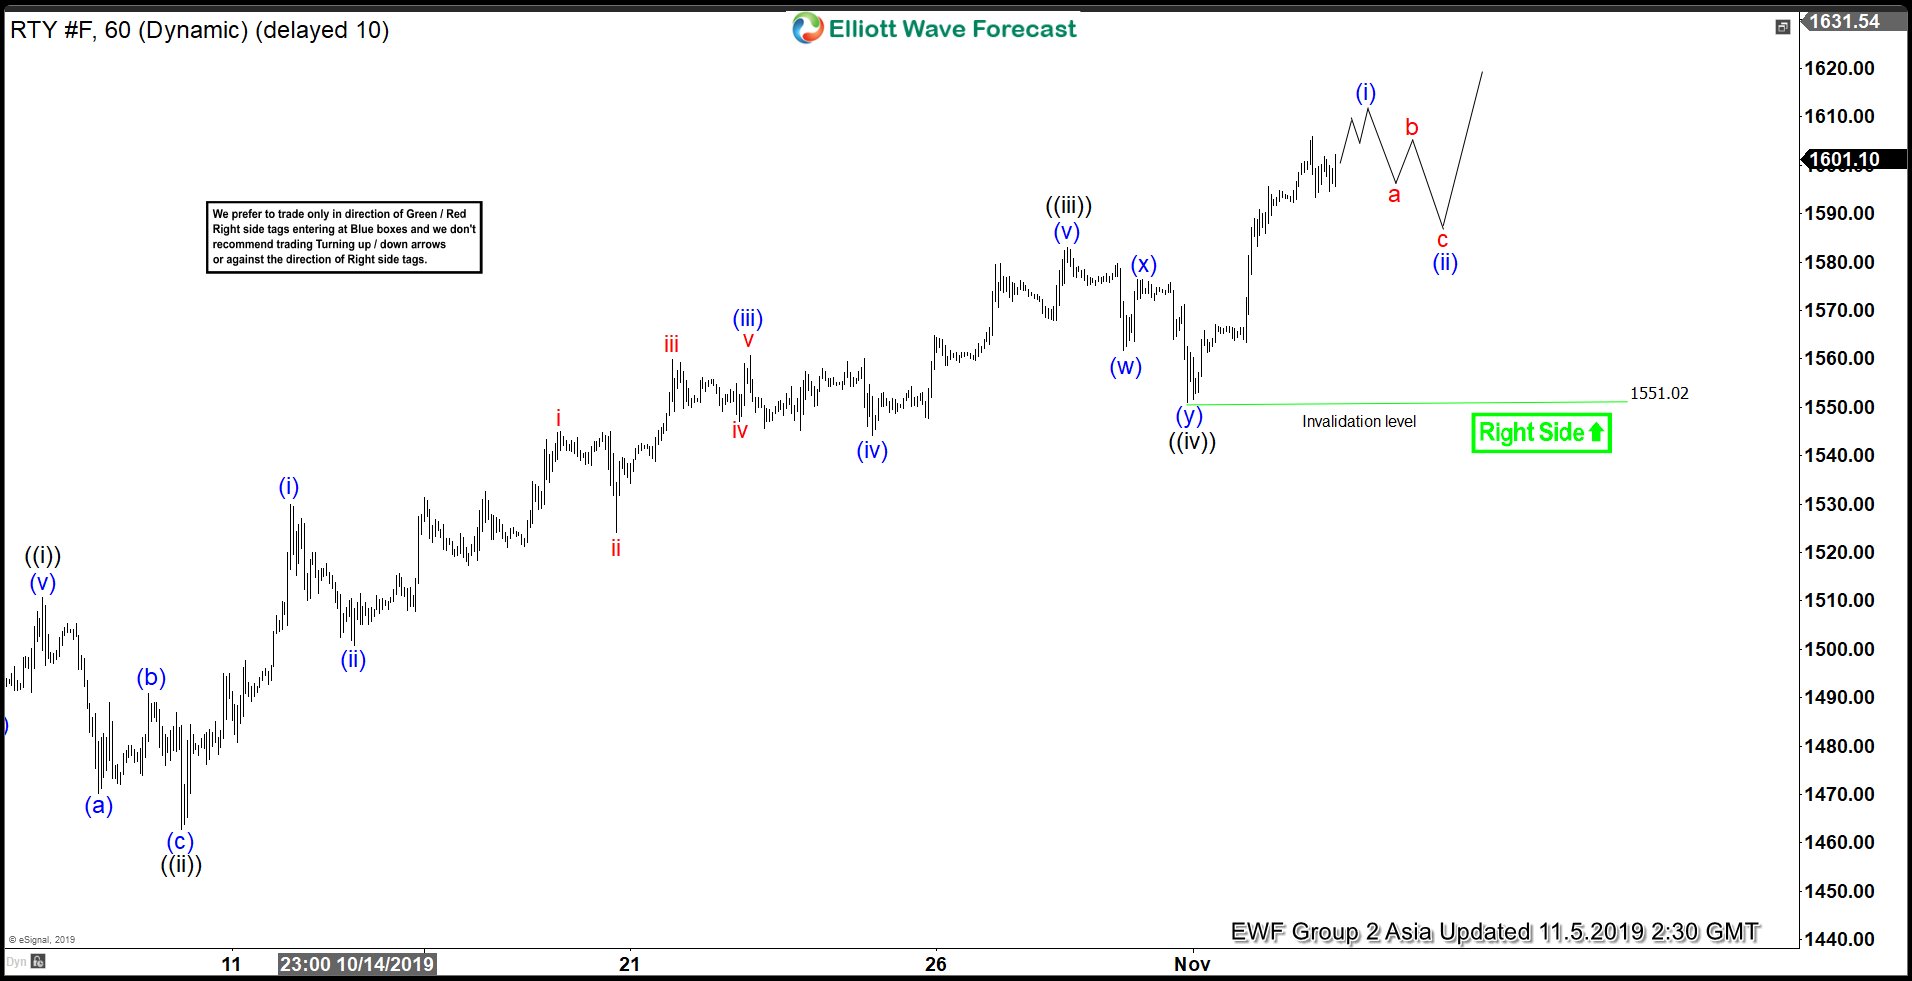
Elliott Wave View on Russell (RTY_F) suggests the rally from October 3, 2019 low is unfolding as a 5 waves impulse Elliott Wave structure. Up from Oct 3 low, wave ((i)) ended at 1510.7 and pullback in wave ((ii)) ended at 1462.70. Index has extended higher in wave ((iii)) with subdivision as another 5 waves in lesser degree. Pullback in wave ((iv)) ended at 1551.02. Index is in the last push higher within wave ((v)). As far as near term pullback stays above 1551.02, Index still can extend higher within wave ((v)).
Alternatively, instead of ending wave (i) of ((v)), Index can end the entire wave ((v)) with 1 more leg higher. In this scenario, it should then pullback to correct the rally from Oct 3 low before the rally resumes. Short term minimum target is a 100% Fibonacci extension from August 26, 2019 low which comes at 1616 – 1653 area. The Index is also close to breaking above the previous peak on May 6, 2019 at 1621.90. If the Index manages to break above this level, it will open up a bullish sequence from December 24, 2018 low which should favor the long side. We don’t like selling any of the proposed pullback in the Index.
Russell 1 Hour Elliott Wave Chart