
XAUUSD Technical Analysis October 12/2019
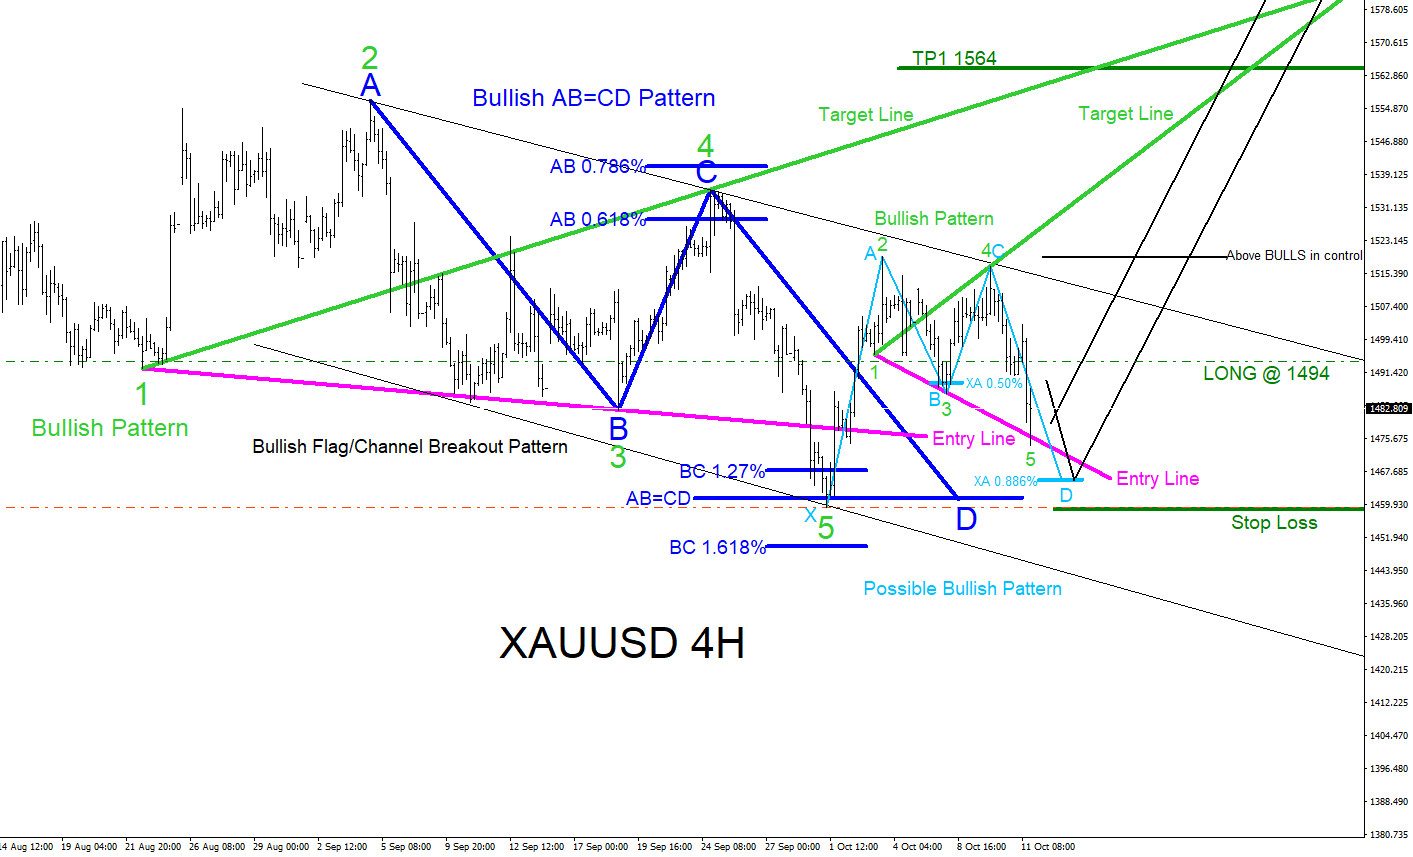
XAUUSD : Possible bullish patterns are visible on the 4 hour chart. Blue bullish AB=CD pattern already triggered BUYS at the point D AB=CD level on October 1/2019. Price has since bounced higher from this level and is now currently in a correction lower and which can possibly bounce higher in the coming days and weeks. There is also another possible bullish pattern if price does another small push lower. Light blue bullish pattern triggers BUYS at the point D XA 0.886% level. As long as price stays above the October 1/2019 low we should expect another round higher. If looking to trade XAUUSD stops should be placed at the October 1/2019 low and looking for a move higher above the September 4/2019 high. Blue bullish pattern is invalidated if price moves below point D of the pattern and light blue bullish pattern is invalidated if price extends below the point X of the pattern. Overall watch for price to hit the green Target Trend Lines of two other bullish patterns that have already triggered BUYS after the green points 5 terminated. One terminated October 1/2019 and the other has just recently reached the entry trend line.
XAUUSD 4 Hour Chart 10.12.2019
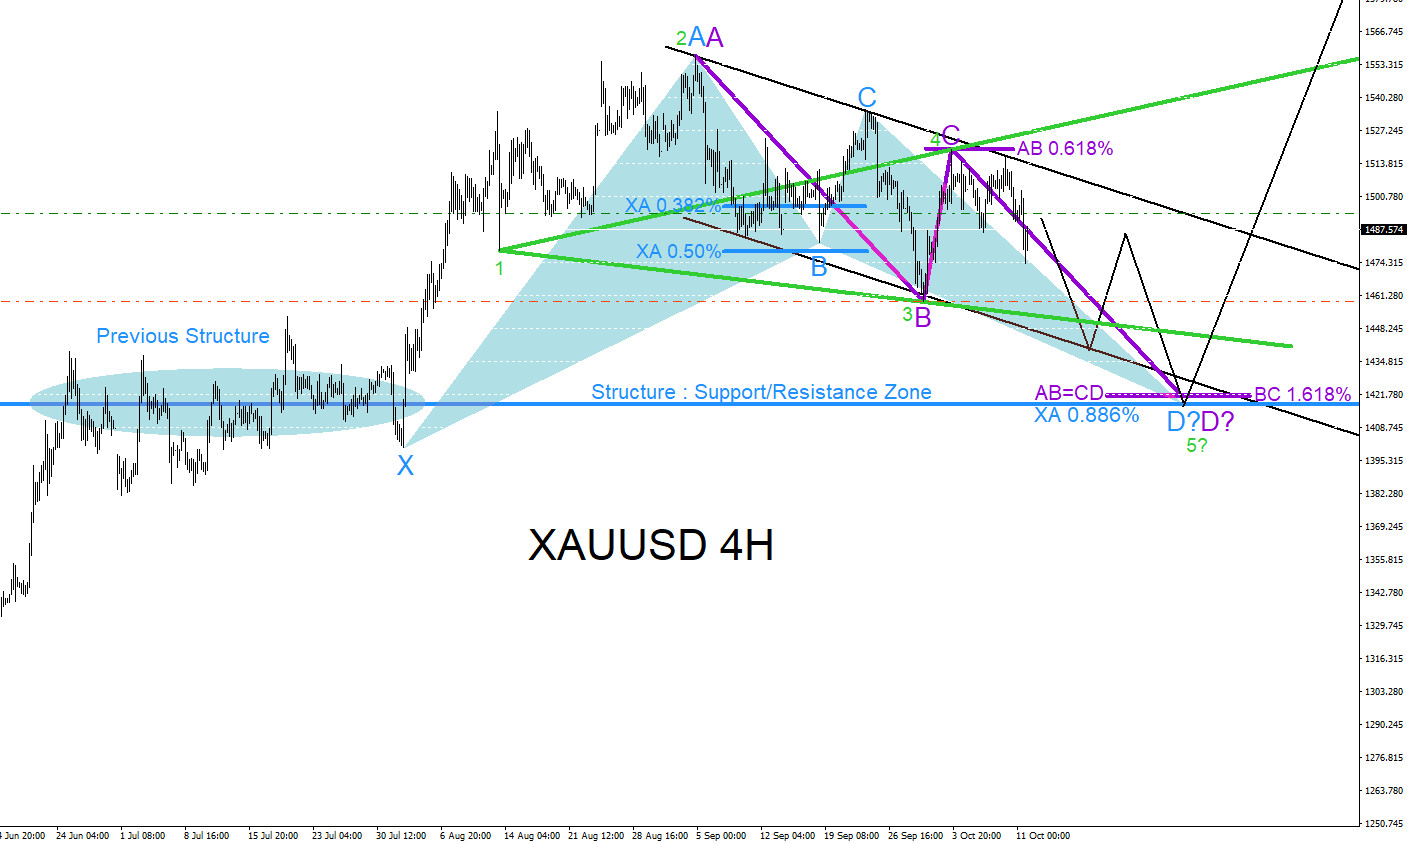
If price moves below the October 1/2019 and stops out the BUY trade then watch for a reaction at the next area of support (see chart below) but traders will need to watch and wait for a reaction/bounce higher at the next support/resistance zone before doing any BUYING.
XAUUSD 4 Hour Chart 10.12.2019
Of course, like any strategy/technique, there will be times when the strategy/technique fails so proper money/risk management should always be used on every trade. Hope you enjoyed this article and follow me on Twitter for updates and questions> @AidanFX or chat me on Skype > EWF Aidan Chan