
GBPAUD Technical Analysis October 12/2019
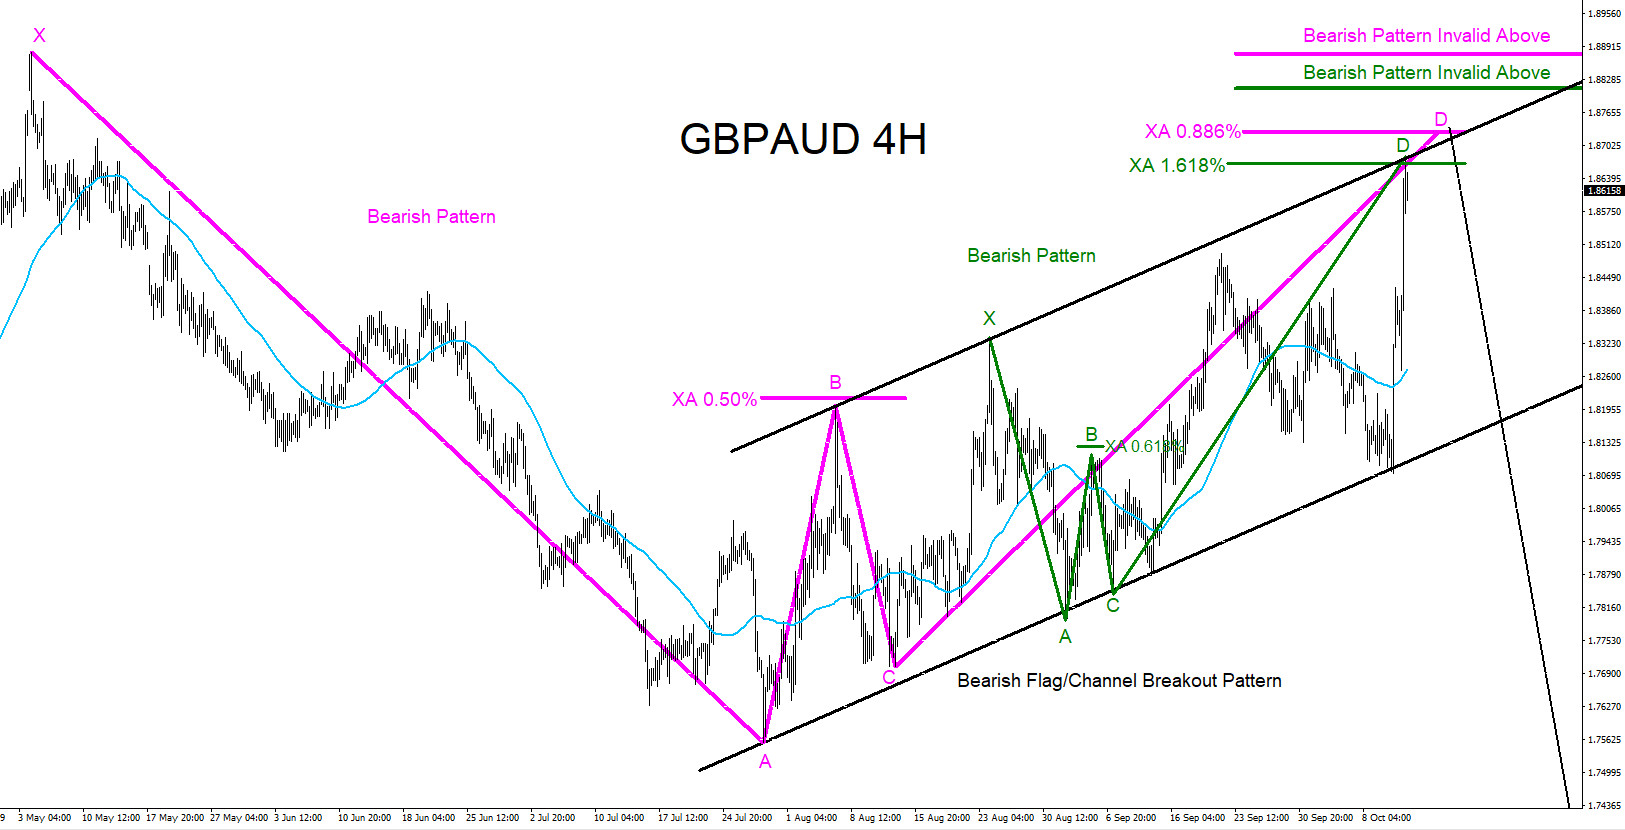
GBPAUD : Possible bearish patterns are visible on the 4 hour chart. Pink bearish pattern triggers SELLS at the point D XA 0.886% Fib. retracement level and the green bearish pattern triggers SELLS at the point D XA 1.618% Fib. retracement level. Traders need to wait and see if price reacts lower from these levels for more confirmation to start selling the pair. As long as price stays below the May 6/2019 high we can expect moves to the downside. If looking to trade GBPAUD stops should be placed at the May 6/2019 high. A move above the May 6/2019 highs invalidates all bearish scenarios. Conservative traders will watch and wait for more confirmation. Confirmation of GBPAUD topping out will be if the pair breaks below the black Flag/Channel bearish market pattern. A break below the black flag/channel bearish pattern can take the pair lower below the July 30/2019 lows. Only time will tell what GBPAUD will do but for now SELLERS/BEARS should watch and wait for a possible reaction lower. Trade what you see and watch and wait to see if the pair decides to move lower.
GBPAUD 4 Hour Chart 10.12.2019
Of course, like any strategy/technique, there will be times when the strategy/technique fails so proper money/risk management should always be used on every trade. Hope you enjoyed this article and follow me on Twitter for updates and questions> @AidanFX or chat me on Skype > EWF Aidan Chan