
USDJPY Technical Analysis
USDJPY last week signalled bulls to enter the market. Why did traders decide to “BUY” the USDJPY pair towards the end of the week for a push higher? Some speculators will say because of fundamental analysis/news but technical traders will say because price hit a confluence zone. Trading confluence is when 2 or more trading strategies converge together and offer a high probability BUY/SELL trade setup. Using different trading strategies to all line up together in a specific price area/zone will offer the trader more confidence in taking the trade and will offer a clearer trade setup where stops, entry and targets can be set in advance. Combining different trading strategies can also be used as “trading filters” to signal the trader on which side to take the trade.
USDJPY 1 Hour Chart 6.28.2019: In the chart below, on June 28/2019 price reacts to a support/resistance zone (filter #1) that a possible bounce higher can happen. A reaction from this zone allows a trader to identify that this particular zone will be an important area where price will possibly signal which side it wants to continue moving on.

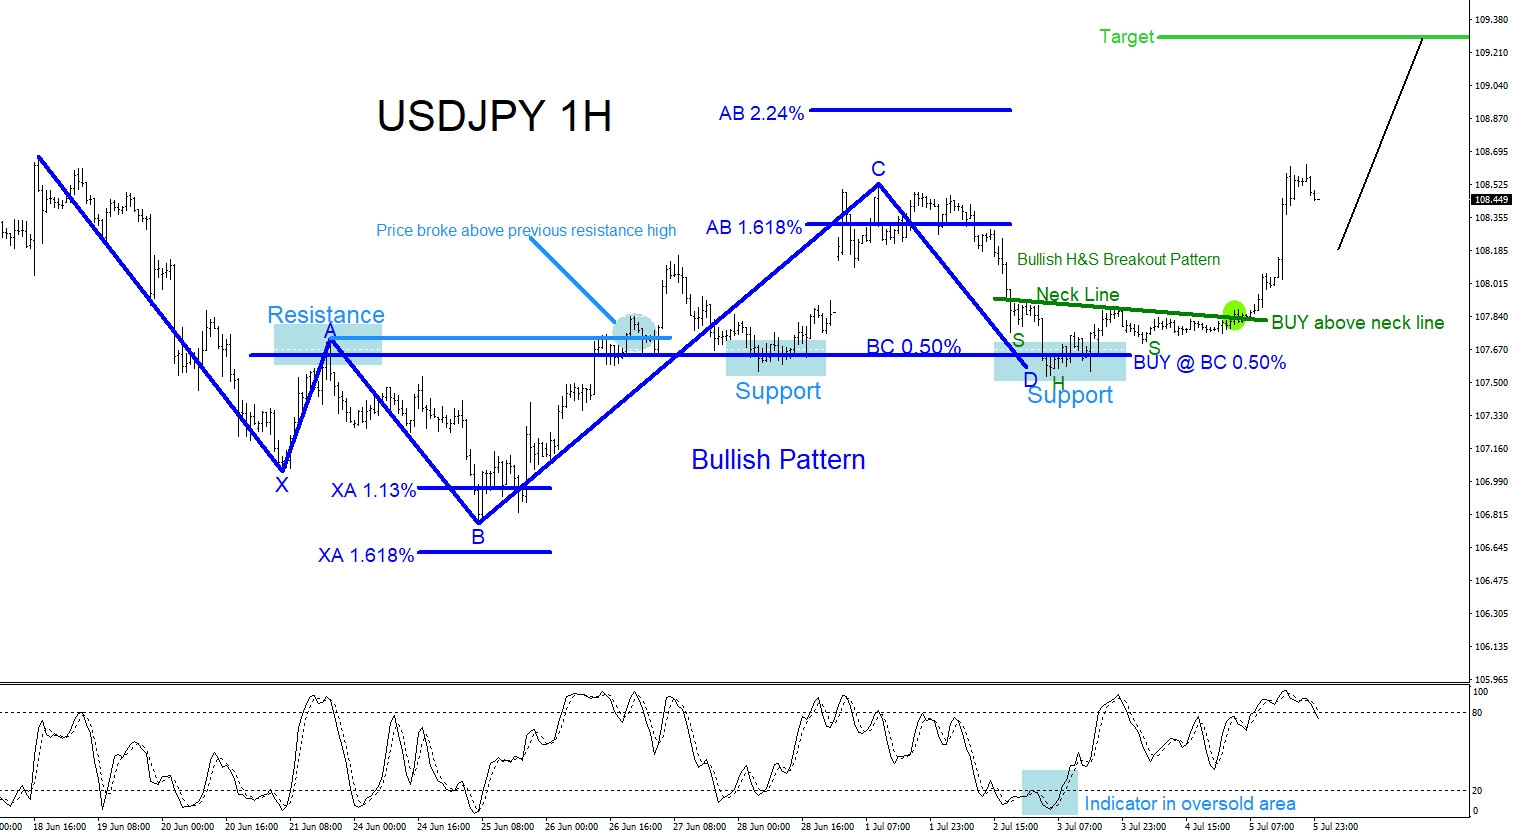
USDJPY 1 Hour Chart 7.5.2019: In the chart below, price pushes higher at the market open of the following week which then forms a possible bullish pattern (blue) where the pattern BUY entry triggers if price moves back lower and hits the BC 0.50% Fib. retracement level. The blue bullish pattern (filter #2) buy entry aligns with previous support zone that was established in the chart above. The stochastic indicator (filter #3) is also registering below the 20 level indicating that price is “oversold” and signalling traders to watch for buying opportunities. Watching the stochastic hit the “oversold” area together with price hitting the support zone triggered more buyers to enter the market. Price reacts higher from the support zone and forms an inverted bullish head and shoulders breakout pattern (green) where more buyers entered the market on the break above the neck line of the bullish pattern (filter #4). Combining trading strategies that are all aligning entry in the same area/zone and are all signalling the same possible direction will give a trader more confidence in entering the market.
Filter #1 Support/Resistance Area, Filter #2 Bullish Market Pattern (blue), Filter #3 Stochastic Indicator, Filter #4 Inverted Head and Shoulders Market Breakout Pattern (green)
Of course, like any strategy/technique, there will be times when the strategy/technique fails so proper money/risk management should always be used on every trade. Hope you enjoyed this article.