ICICI Bank Limited is an Indian multinational banking and financial services company headquartered in Mumbai, Maharashtra with its registered office in Vadodara, Gujarat. As of 2018, ICICI Bank is the second largest bank in India in terms of assets and market capitalisation. In this technical blog, we would take a look at the cycle since 2009 low in ICIC Bank and also look at the Elliott Wave Count since 257.41 (July 2018) low and present our forecast going forward.
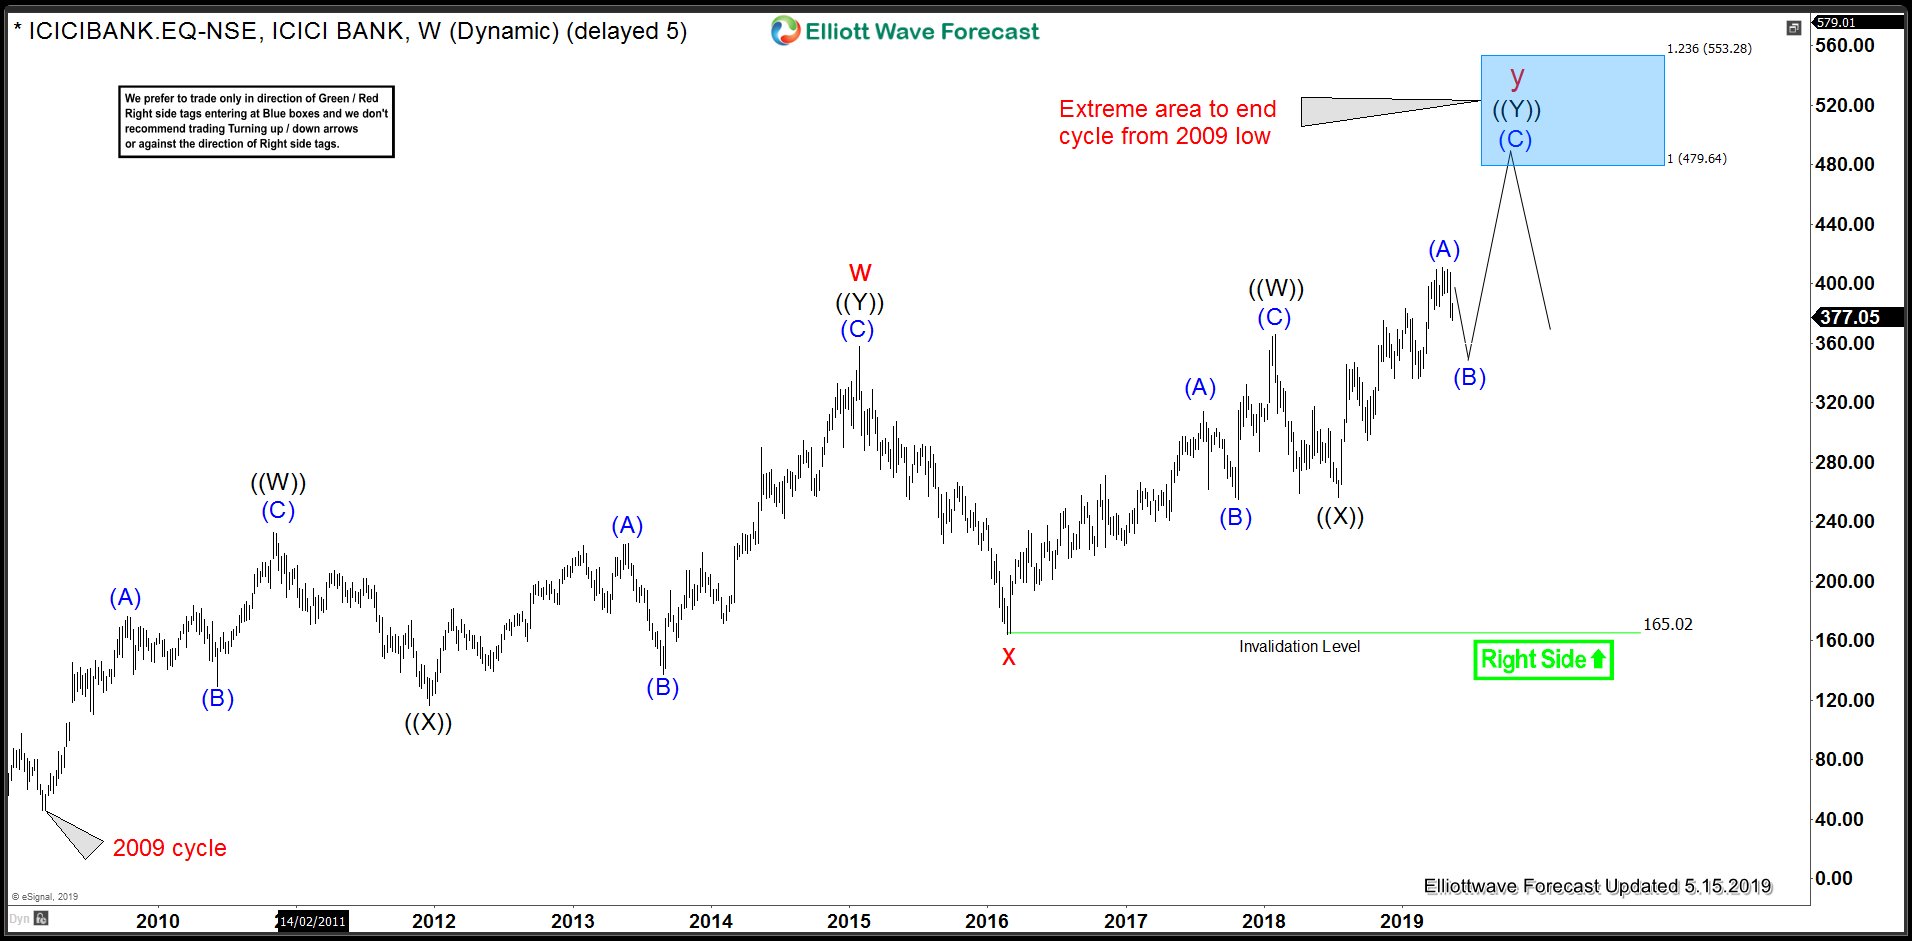
ICIC Bank Weekly Chart: 2009 Cycle Still Alive
Chart below shows the Weekly chart of ICIC Bank and it covers the rally from 2009 low, rally from 2009 low is overlapping and is corrective in nature and could be best described and labelled as a double three Elliott wave structure. 100 – 123.6% Fibonacci extension area of red w-x cycles would be the natural target area which gives us a target between 479.64 -553.28. Rally from 2016 low (red x) appears to be unfolding as a double zigzag Elliott wave structure , we can see 5 swings up from red x low which means sequence is incomplete and hence we see the current pull back to be corrective and another buying opportunity for a move higher toward 479.64 – 553.28 area.
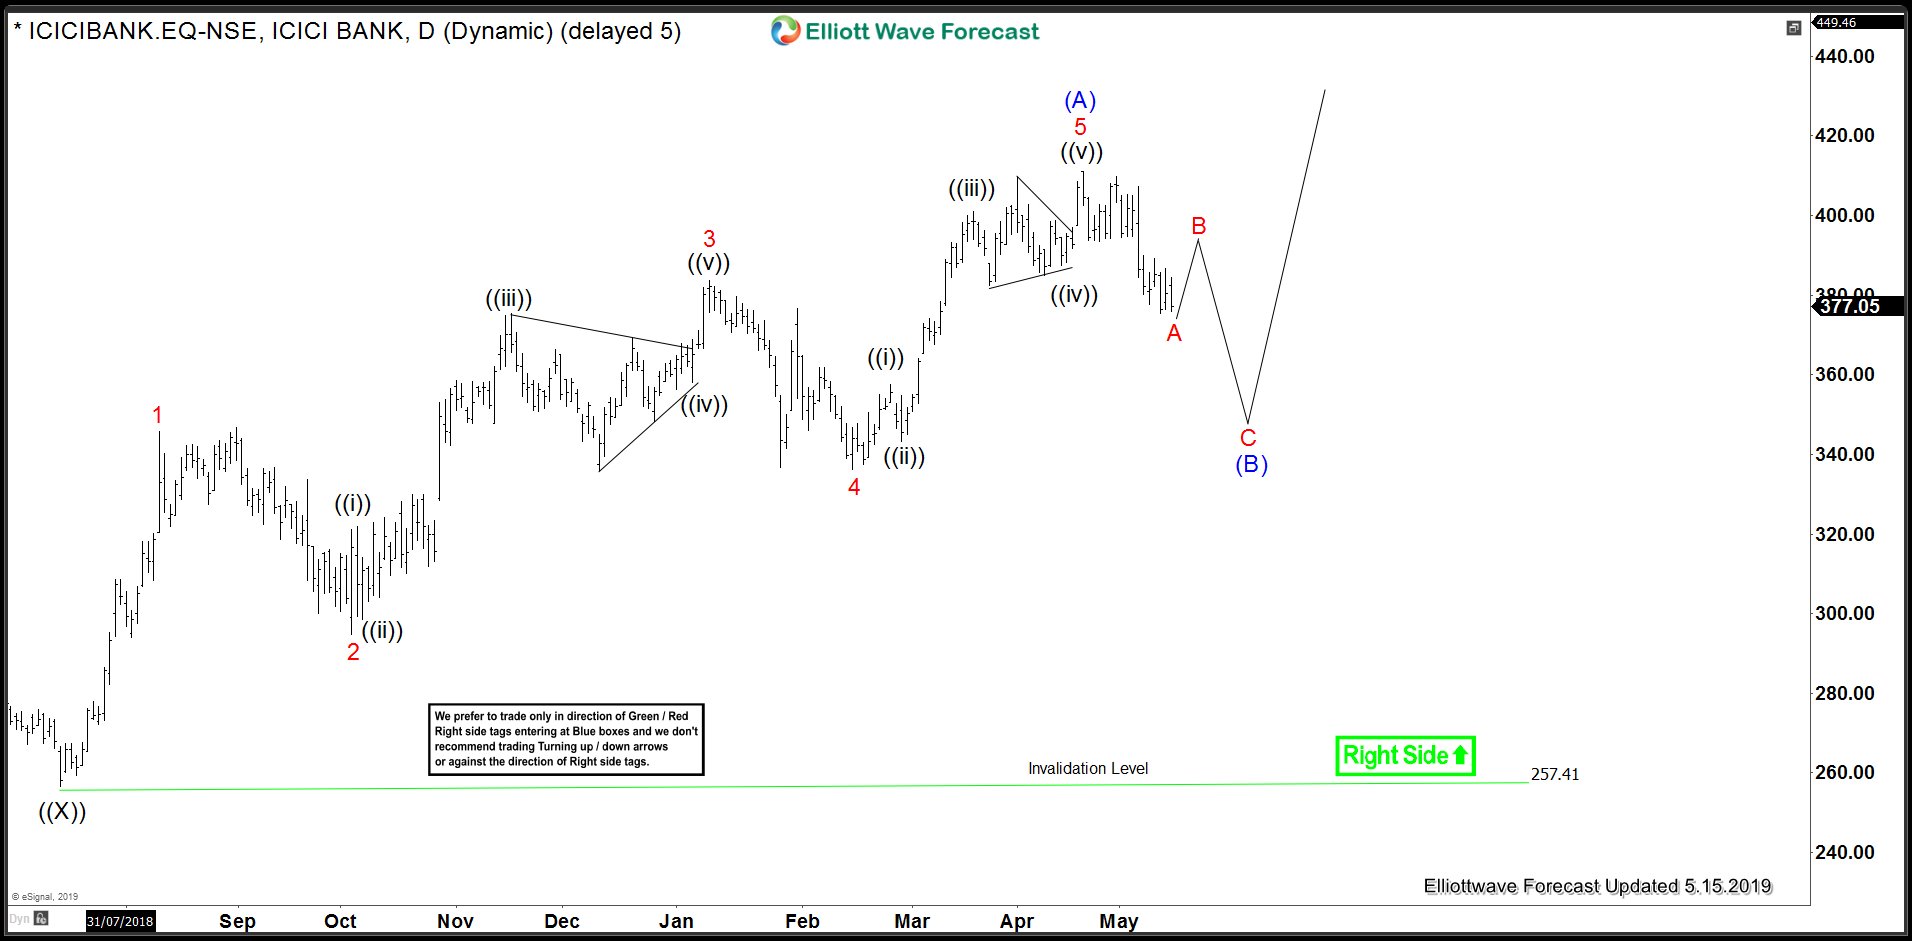
ICIC Bank Daily Chart Elliott Wave Analysis
Rally from 257.41 could be viewed as a 5-3-5-3-5 leading diagonal structure which completed at 411 on 4/18. Down from there, the decline appears to be impulsive so should just be ending 1st leg of a 3 waves pull back in wave (B). Expectations are for a bounce to fail below 411 peak for another leg lower to complete a zigzag Elliott wave structure in wave (B). We don’t like selling and our preferred strategy calls for buyers to appear after 3 waves down in wave (B) to resume the rally for a new high toward 479.64 – 553.28 or a 3 waves bounce at least.