
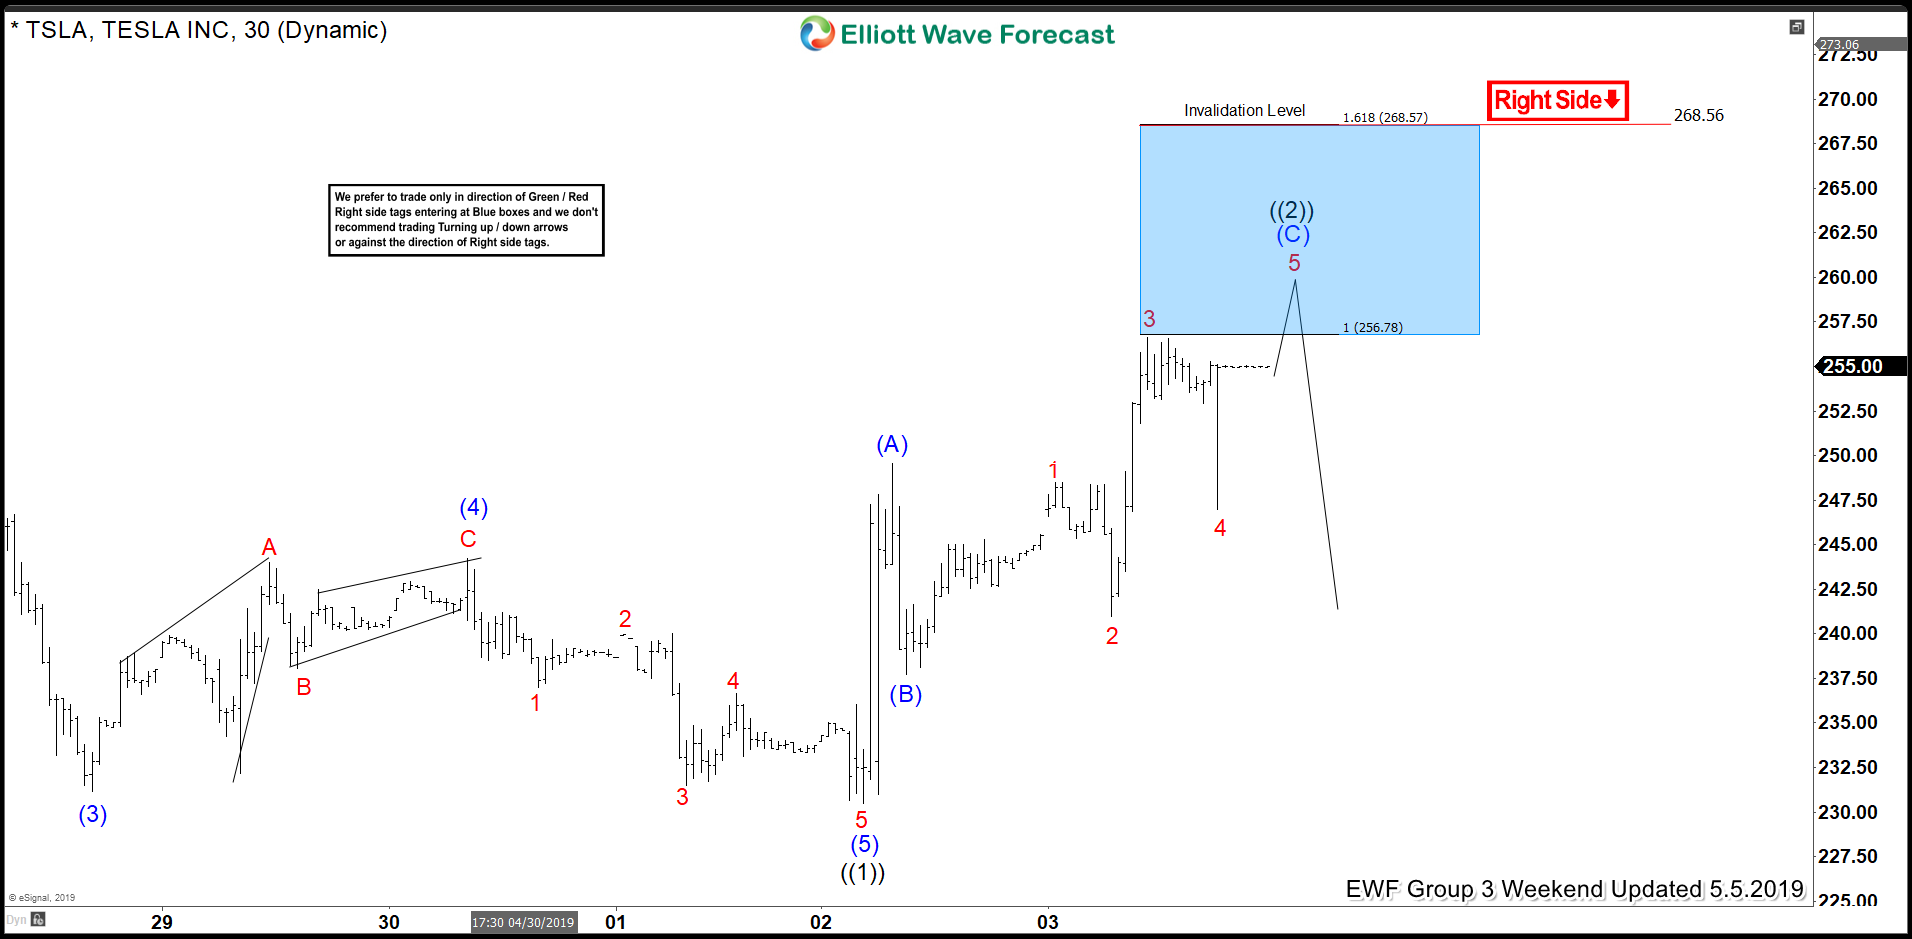
In this blog, I want to share with you some Elliott Wave charts of Tesla which we presented to our members earlier this month. You see the 1-hour updated chart presented to our clients on the 5/5/19. Tesla had a 1-hour right side tag against 268.56 peak suggesting more downside at that time.
Tesla ended the cycle from 04/03/19 peak in black wave ((1)) at 05/02/19 low (230.52). Above from there, we expected a bounce to occur in black wave ((2)). The bounce unfolded in an Elliott Wave Zig Zag correction. We advised members that Tesla should continue lower. Therefore, we expected sellers to appear in the sequences of 3, 7 or 11 swings. At the 100 – 1.618 Fibonacci extension of blue (A)-(B) which came at around 256.78-268.56 area and that was the first area for selling the stock for short-term traders.
Tesla 5.5.2019 1 Hour Chart Elliott Wave Analysis
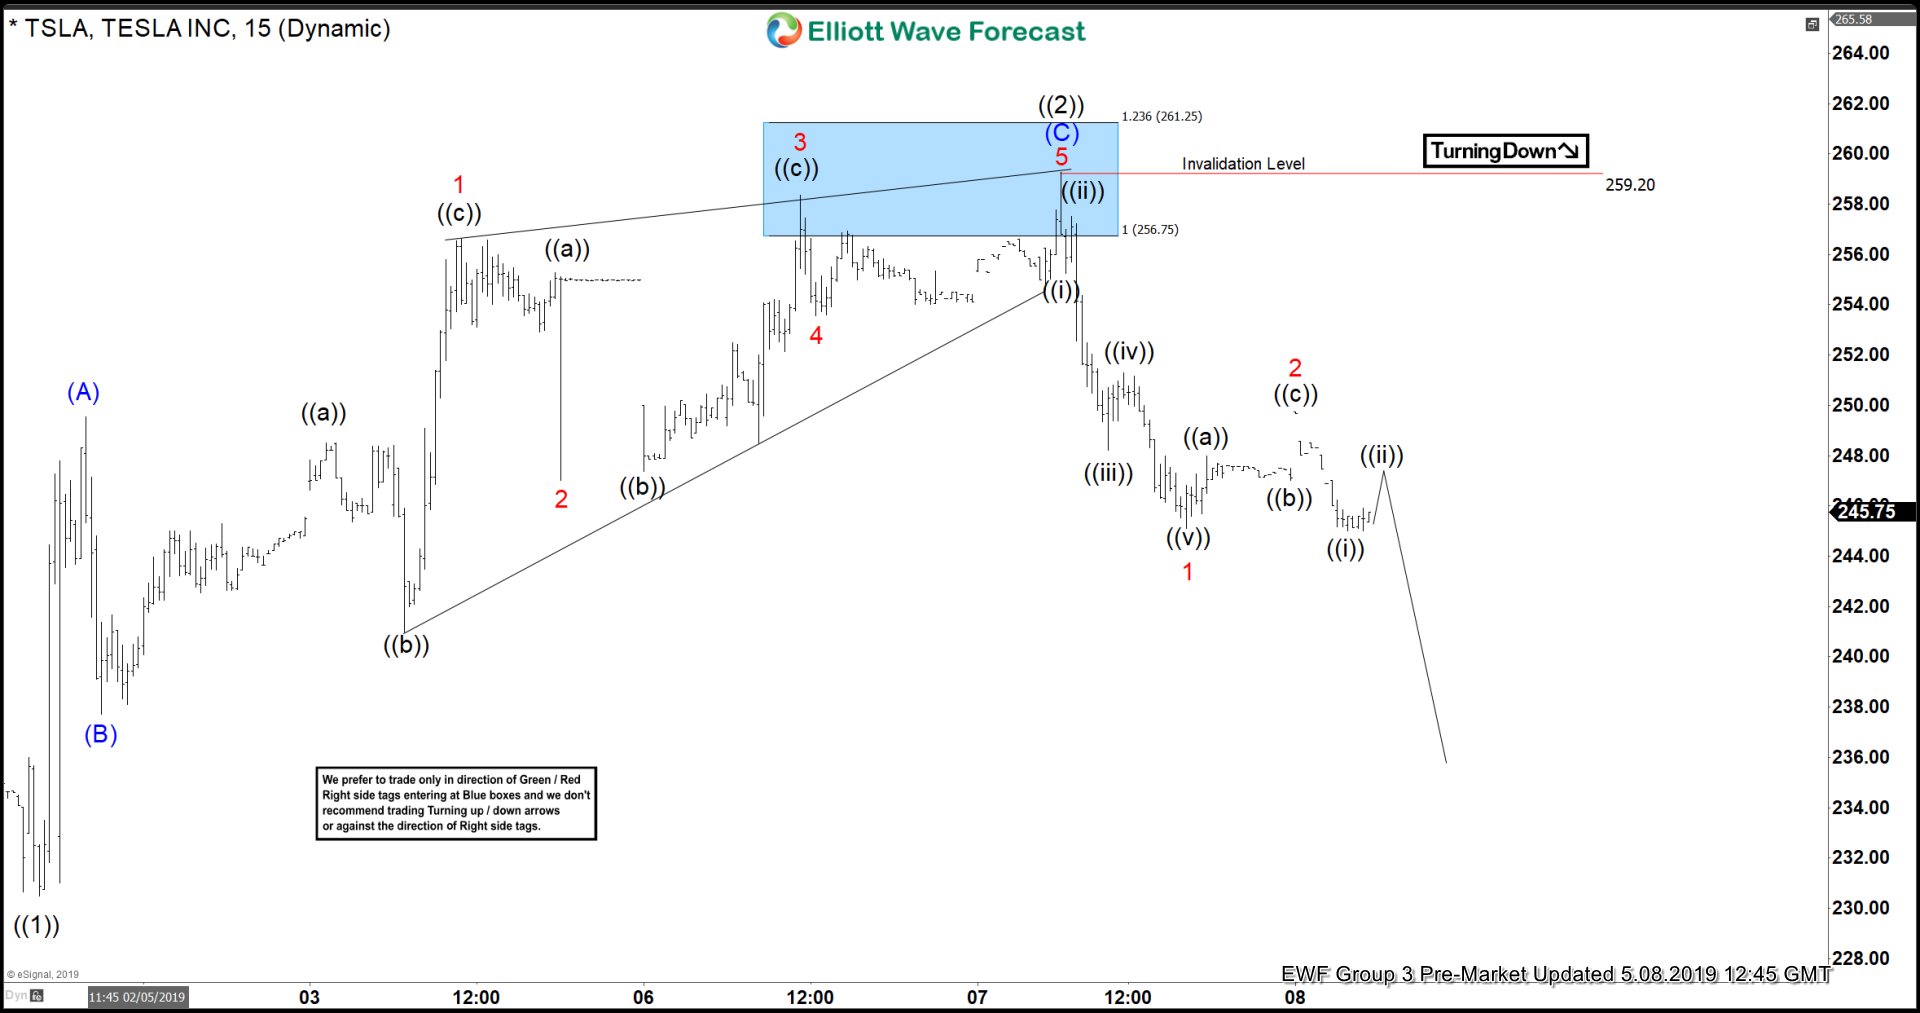
In the last Elliott Wave chart. You can see that the stock reached the blue box area. So short-term traders could have opened a short position at the blue box (256.78). Immediately the stock reacted perfectly lower. Any trades from our blue box area shown in the chart above were risk-free, which means the stop-loss should be moved to break even, and Tesla even hit the minimum target of 226.4+ afterwards which could have produced a fast gain. Please keep in mind that the 1-hour chart which I presented has changed. This blog should just illustrate how accurate our blue boxes are, and how our members trade our 3-7 or 11 swings strategy.
If you are interested in how to trade our blue box areas and want to understand how Elliott Wave works. Then I recommend you to get a shot on our 14 days free trial below. We present a lot of trading setups in our 3 Live Trading Rooms.
Tesla 05.08.2019 1 Hour Chart Elliott Wave Analysis
I hope you liked this blog and I wish you all good trades.