
SPY. The Elliott wave Theory is a Technical Analysis method that traders use to analyze the market and located the trend by using the relationship between highs and lows and applying a system developed by Ralph Nelson Elliott in the 1930s. Almost 100 years have passed now since it was developed, and the Market has changed. The principle is very simple and comes with clear three rules.
• Wave 2 never retraces more than 100% of wave 1.
• Wave 3 cannot be the shortest of the three impulse waves, namely waves 1, 3 and 5.
• Wave 4 does not overlap with the price territory of wave 1, except in the rare case of a diagonal triangle formation.
Such a simple system to forecast something so complex like the Market will create a lot of subjective outcomes and it is not enough to archive a higher degree of success.
The Elliott Wave Theory main pattern is the one in which the Market always advance in 5 waves and each subdivision is also 5 waves in lesser degree cycles. The idea of the 5 waves is known as Motive or Impulse wave and most of the time go with the main trend based on the original concept, as we are showing in the following chart.
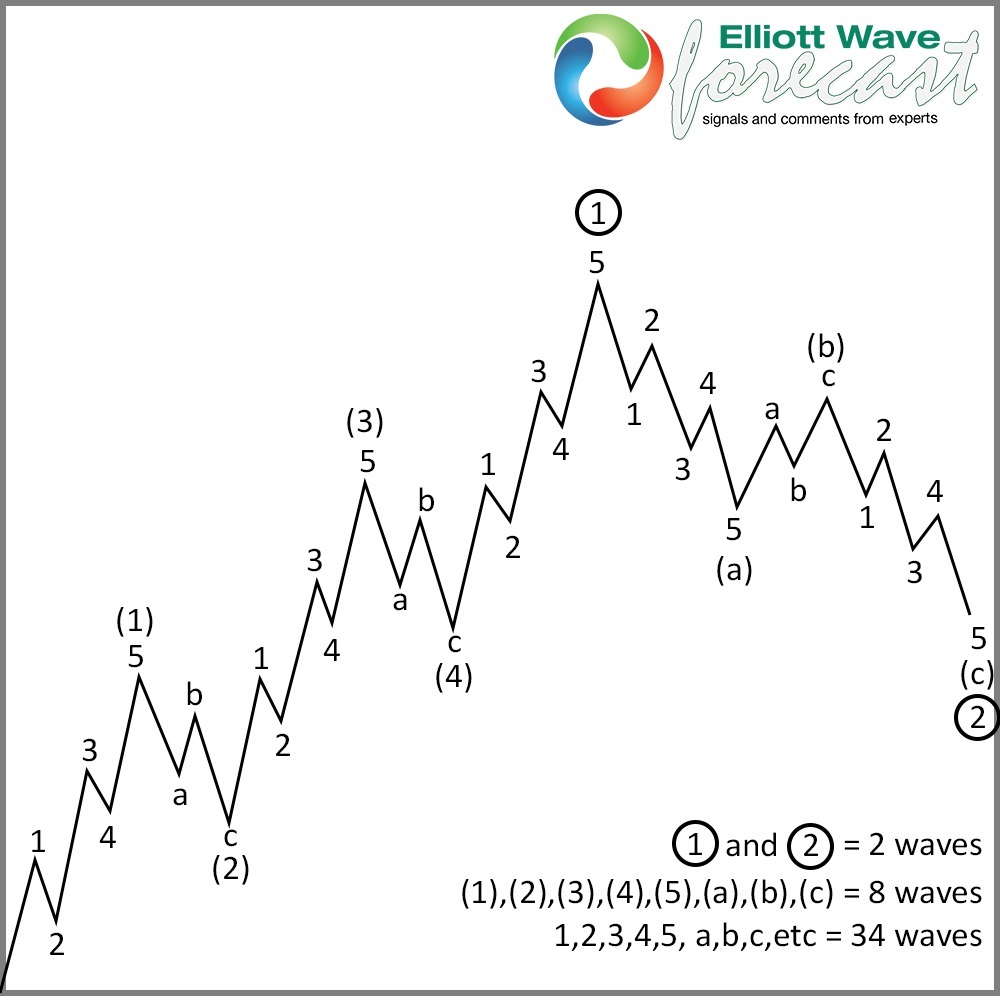
If we look at the chart from the beginning of the cycle. There are 3 big cycles, which are labeled in 1-2-3, but only making a 4-5 will make the whole structure an Impulse. By nature, it is always either wave 1-3-5 which will extend and in most of the cases wave 3 is the extended one.
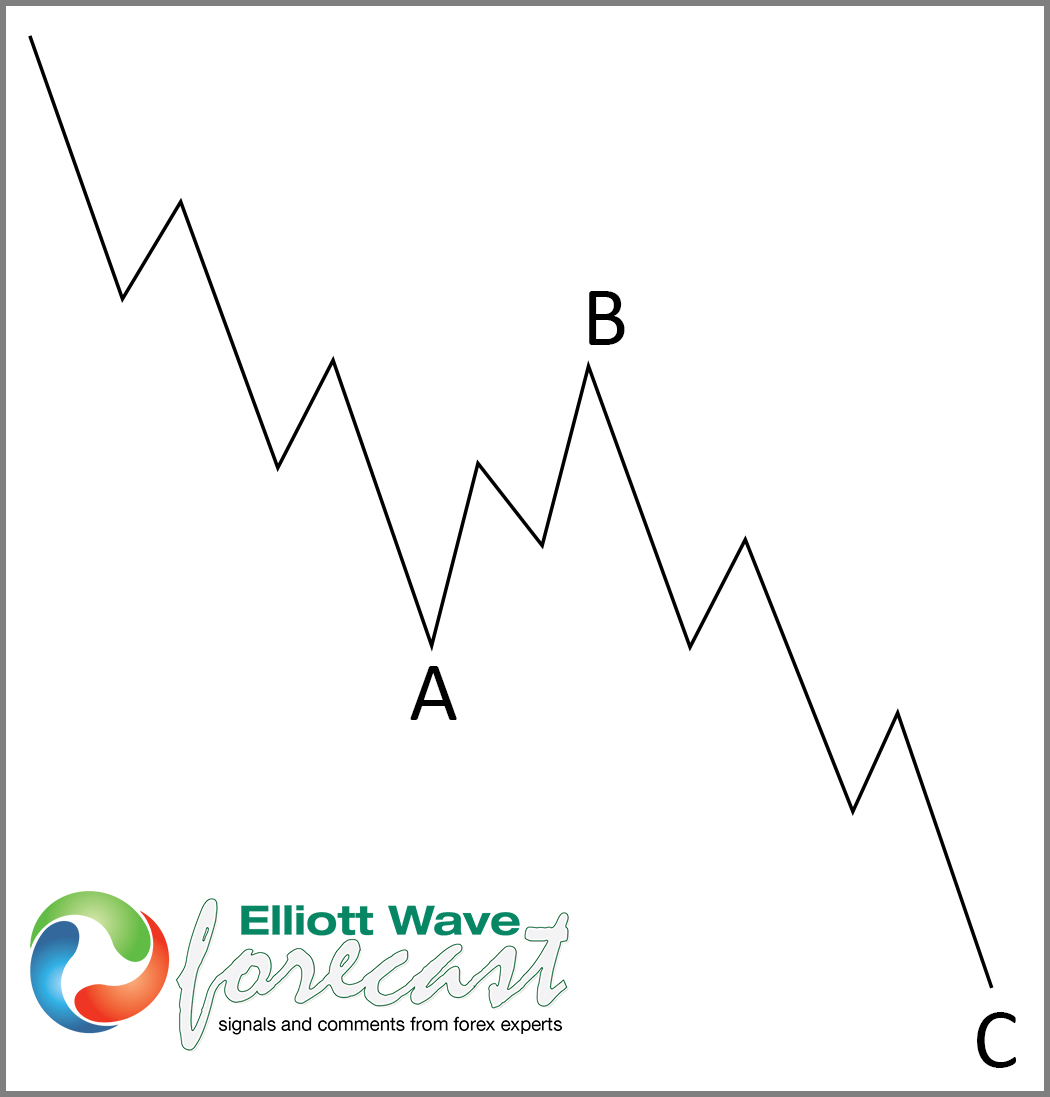
Looking at the same chart, when the cycle ends and then corrects back in 3 waves, it is what is called an ABC pattern. Which is 3 cycles against the main cycle and comes in a wave of 5-3-5.
Like we mentioned above, Mr. Elliott concept is too simple and opens the door for subjective nature. Therefore, we have added rules to the three originals ones to make the concept better.
One of the new rules is the one that makes the difference between an Impulse and an ABC which is the extension. If wave 3 or C pass the 1.618% it means that it is an impulse over an ABC. By sequences, both structures are the same until wave 3 or C ends. In concept 3 cycles, 2 of them in the same direction and subdivided in 5 waves and a connector between them in 3 waves. The following chart is showing an ABC which is a 5-3-5 structure.
As we can see it is the same as the first 3 legs in the previous 5 waves chart. In our new concept, the difference between them is that in an impulse, wave 3 needs to pass the 1.618% extension between 1-2 and at that moment the ABC pattern will become an impulse by rule. This rule is very simple and it will save a lot of subjection to traders and will make them not to pick the wrong side of the market.
For years, we were mentioning how the SPY is within the Blue Box from the Grand Supercycle and that the $318.00 area is key. Which is the same as $3180 in the SPX Index. This level will make a huge difference for the next years in SPY. When many believe a huge decline in World Indices is about to happen and keep selling them, we keep pushing the upside for the last years. Have a look at the following blog we did in the past.
We are waiting for confirmation yet about the $318.00 level in SPY, which is only 24 points away. If it manages to reach that area it will tell that we can be ending a cycle in the Supercycle degree from 2009 But the Grand Supercycle will be extending higher after a pullback. Which can be seen in the chart below:
SPY Monthly Elliott Wave Chart 04.29.2019
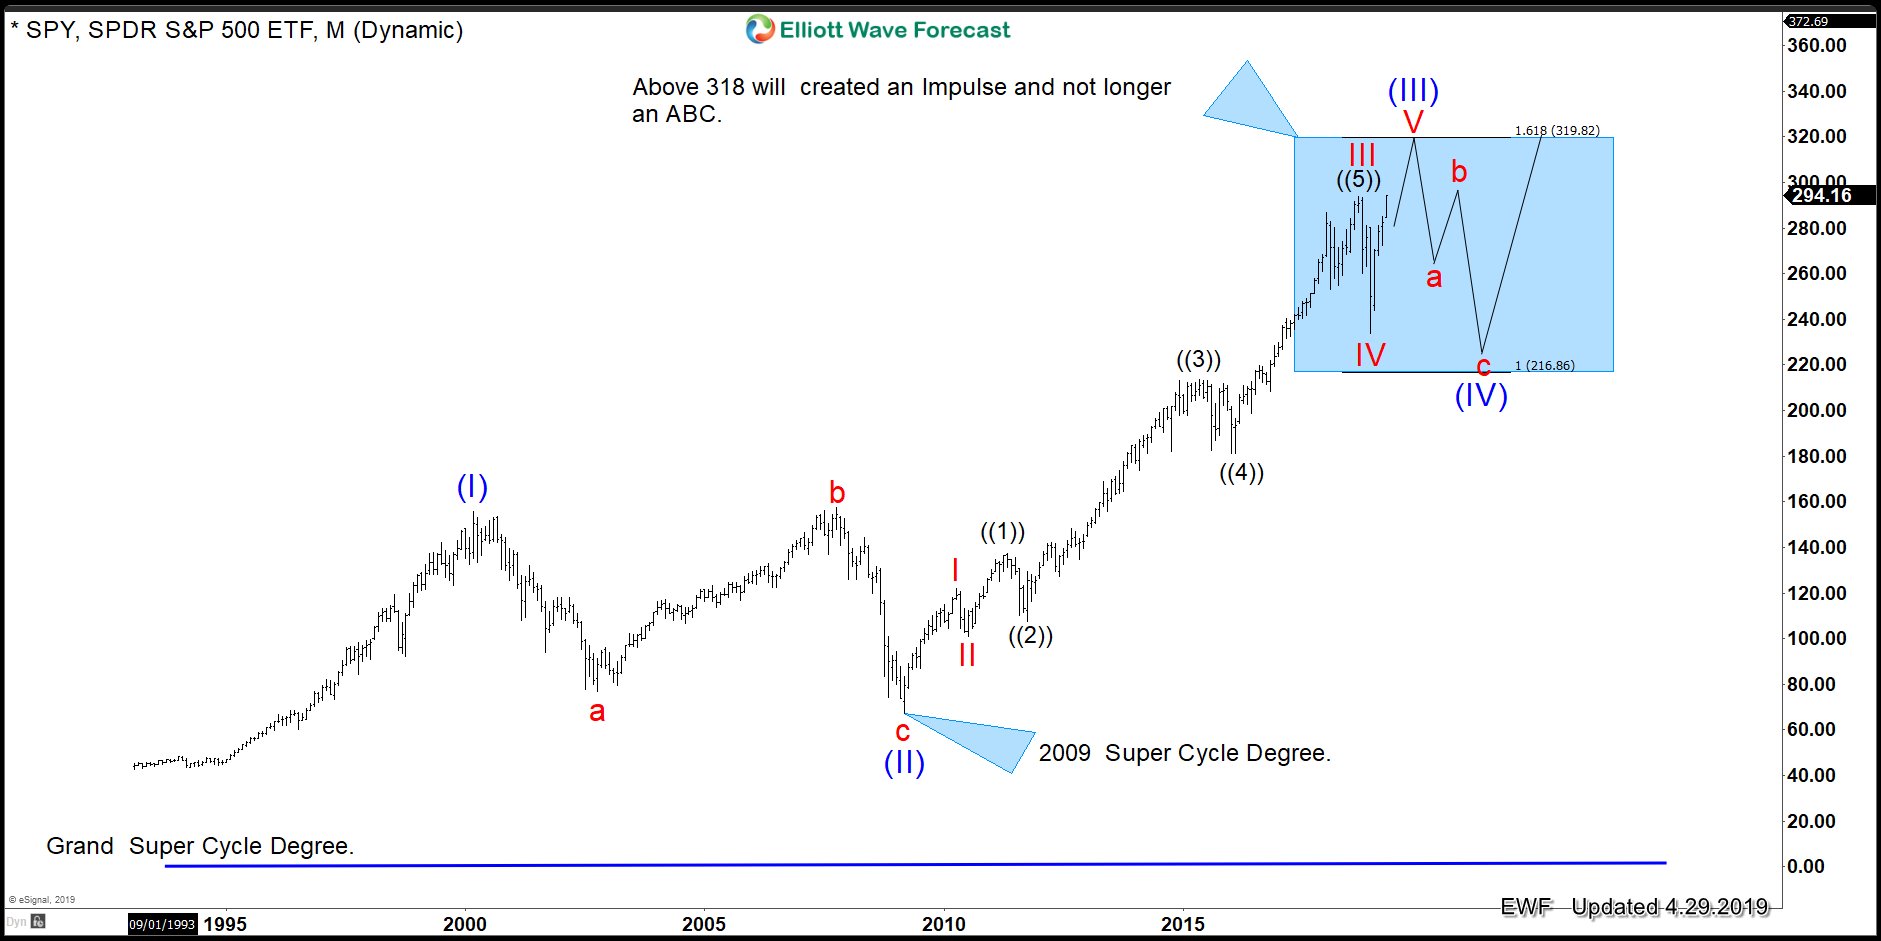
The $318.00 level is the 1.618% extension between (I) and (II) and by reaching it, it will make the difference between an ABC or impulse since the all-time lows.
In 1930s Mr. Elliott did not have tools like we have today. He was a genius in his own way, but with today’s tools, Traders and Elliott Wave Services needs to make it better and follow the progress instead of applying a very open concept which is a century old. $318.00 will open the door to $400.00 in the years to come and provide another multi-year cycle.