Short term Elliott Wave view on S&P 500 Futures (ES_F) suggests that the rally from March 9, 2019 low (2726.50) is unfolding as a 5 waves impulse Elliott Wave structure. The Index is now within wave (3) which subdivides in 5 waves of lesser degree. In the chart below, we can see wave 3 of (3) ended at 2899.5 and wave 4 of (3) pullback ended at 2877.61.
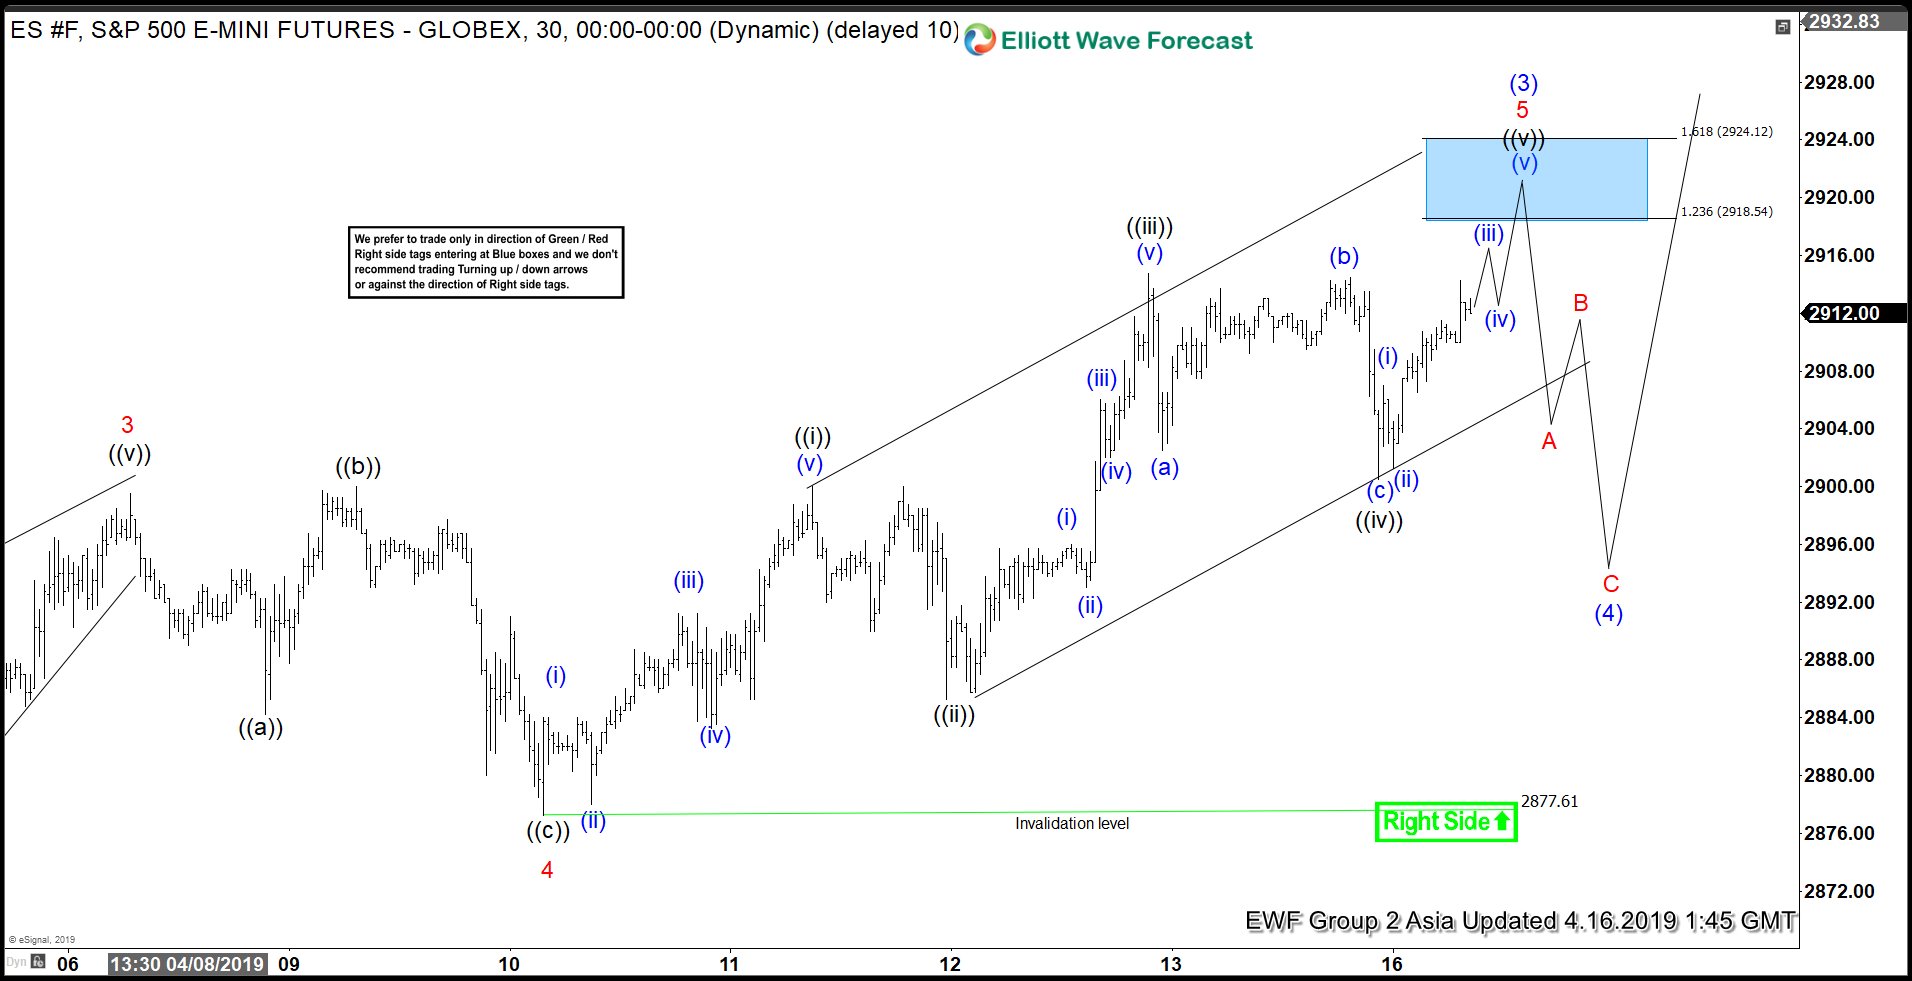
Short term, expect the Index to extend higher towards 2918.54 – 2924.12 to end wave 5 of (3). Subdivision of wave 5 is unfolding as a 5 waves impulse of lesser degree. Up from 2877.61, wave ((i)) ended at 2900 and wave ((ii)) pullback ended at 2885.25. Rally to 2914.75 ended wave ((iii)), and wave ((iv)) ended at 2900.50. Wave ((v)) of 5 is in progress towards 2918.54 – 2924.12. Afterwards, Index should end wave (3) and pullback in wave (4) to correct cycle from March 25, 2019 low before the rally resumes. The pullback in wave (4) is expected to stay above March 25, 2019 low (2790.25) for further upside. We don’t like selling the Index.
1 Hour S&P 500 Futures (ES_F) Elliott Wave Chart Asia Update