
At the beginning of the year, TRV often moves into a price‑discovery phase shaped by analyst updates and early‑quarter earnings expectations. Most analysts rate the stock as a Hold, with an average 12‑month target near $294.25. That level suggests only a 3.13% upside from current prices, which signals that institutions expect steady underwriting results rather than a major re‑rating. Analysts also expect quarterly EPS to fall to $0.62, even though revenue may grow 8.5%. This mix of rising sales and softer earnings usually keeps valuation ranges tight during the first quarter.
Even so, early‑year volatility may depend on earnings surprises. Estimate revisions have inched higher by about 0.3% over the past month, showing a slight increase in analyst confidence. TRV also has a history of beating EPS expectations, which can act as a short‑term catalyst if margins or catastrophe losses come in better than forecast. Because of that, the first quarter becomes a confirmation stage. If TRV delivers a strong report, the stock may push toward the upper end of its target range. If not, it may stay range‑bound while models adjust loss‑ratio and premium‑growth assumptions.
Elliott Wave Outlook: TRV Weekly Chart August 2025

Back in August, we explained that the TRV chart showed a mature Elliott Wave impulse on the weekly timeframe. We expected the bullish cycle to approach its final stage. The structure looked like an ending diagonal from waves ((1)) to ((5)), which often signals exhaustion. At that time, we highlighted a resistance zone between 279.63 and 295.09. We calculated that area using Fibonacci levels. We noted that if the stock failed to extend higher, it could trigger a strong reaction lower.
Even then, we stressed the value of trading only in the direction of the green and red Right Side tags. That approach kept traders aligned with the dominant trend. The chart suggested caution, even with upside targets still active. The structure favored a corrective pullback in waves a, b, and c. We expected that decline to create cleaner re‑entry opportunities for traders following the broader wave pattern.
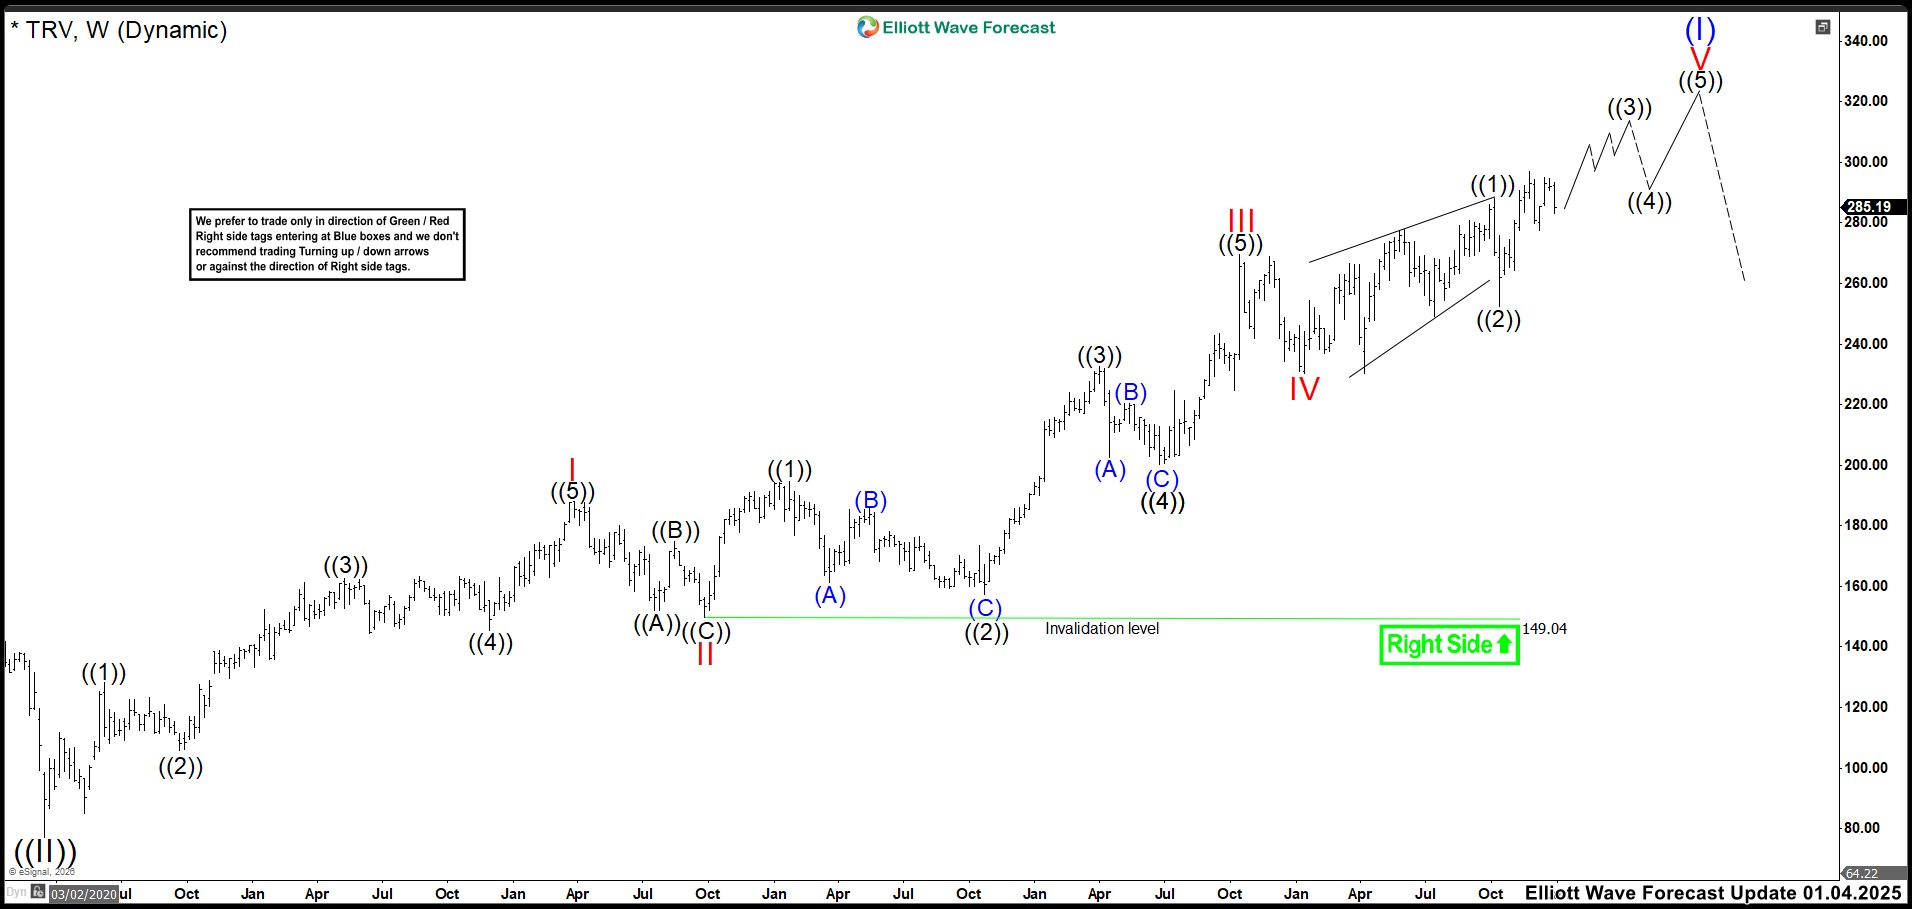
Elliott Wave Outlook: TRV Weekly Chart January 2026
As we can see in the TRV update, the market completed the diagonal and reacted lower as expected. However, that decline turned out to be only a correction because the market quickly broke to new highs. This shift means the move from the wave IV low formed a leading diagonal, which we label as wave ((1)). The October decline corresponds to wave ((2)), and we are now trading in wave ((3)) of V.
Therefore, we expect more upside to complete wave ((3)) and eventually finish the impulse of wave V. Even so, there is still a chance that wave V is unfolding as an ending diagonal. This will depend on how high wave ((3)) can reach and how deep the pullback in wave ((4)) becomes. If wave ((3)) fails to create enough upward separation and wave ((4)) produces a deep correction, without breaking below the wave ((2)) low, then we remain inside an ending diagonal. This scenario still supports more upside, although not as aggressively as the chart suggests.
Source: https://elliottwave-forecast.com/stock-market/trv-extends-rally-impulse-drives/