
Welcome traders, today we look at a couple of 30-min Coffee futures (KC_F) charts and its price action within hours. The following analysis will show how profitable and efficient it can be to trade with our philosophy and basic Elliott Wave analysis.
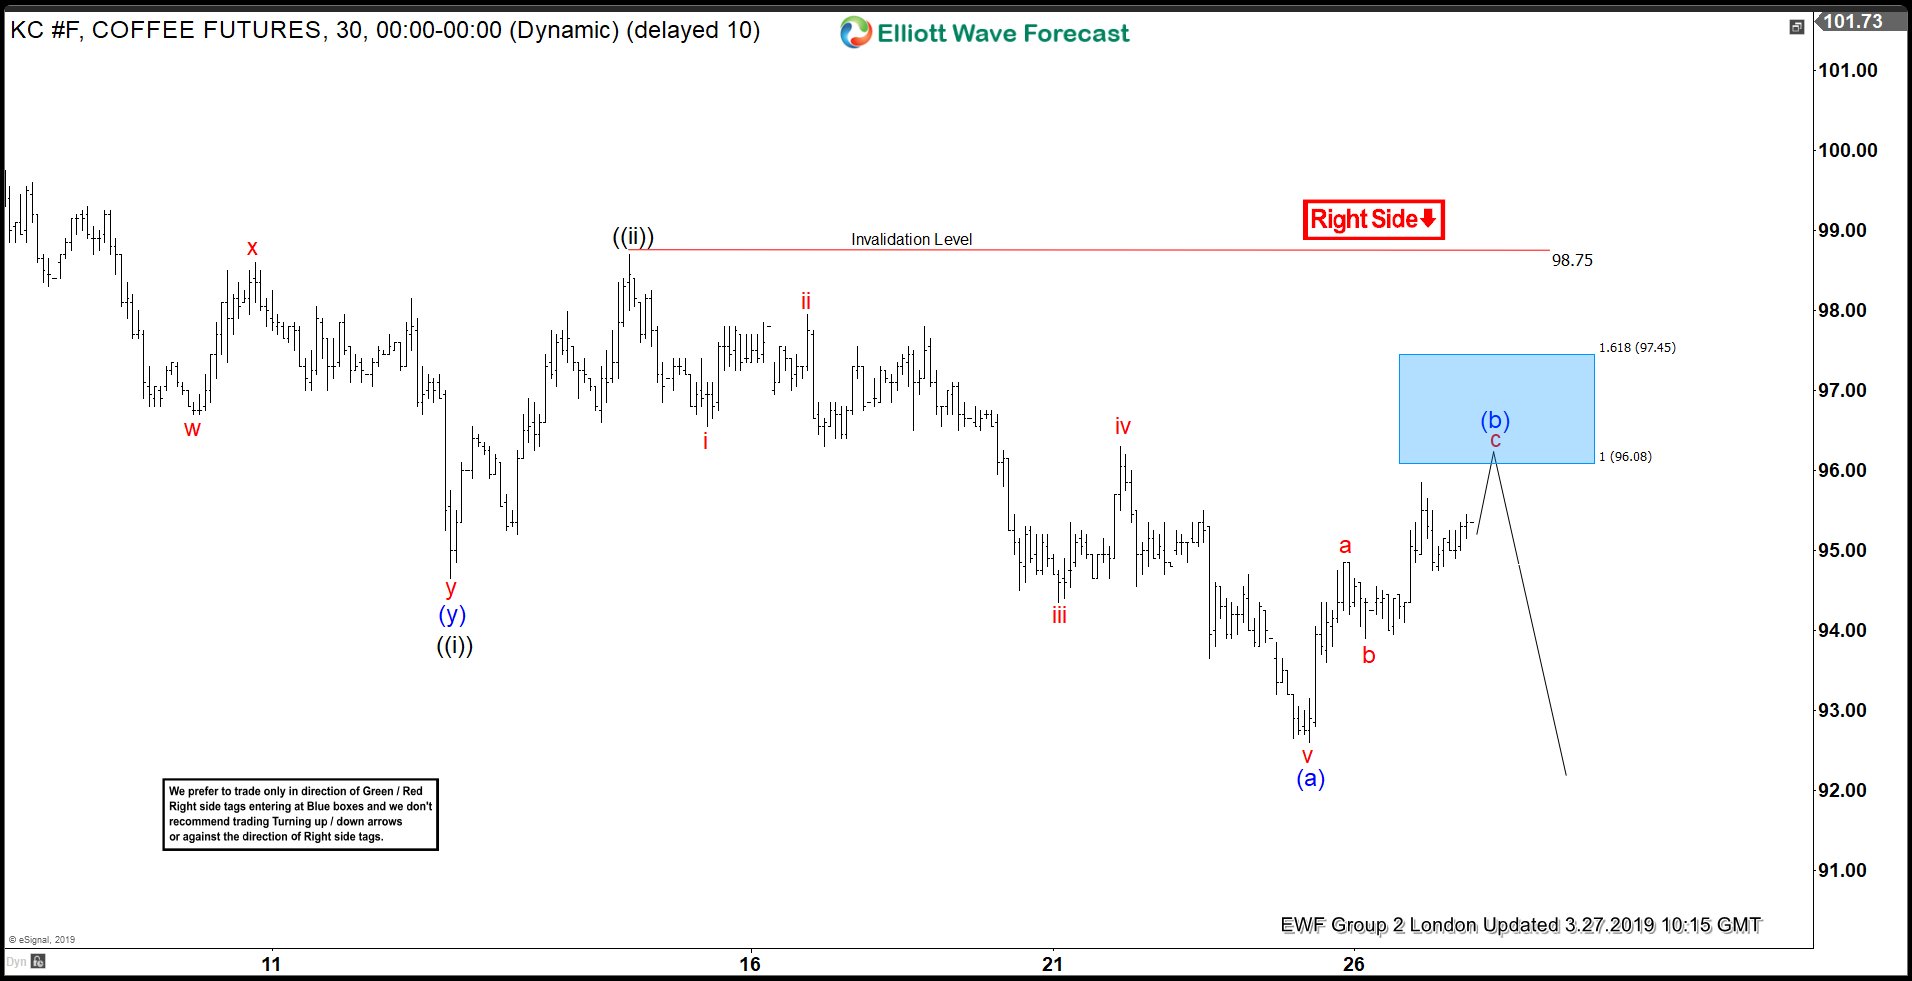
First of all, we start on March 27th with a 30-minute chart presented to our members. Here, we believe the market favors the downside in the near term based on our count. The top at $98.75, labeled as wave ‘((ii))’, serves as a resistance pivot after finishing a 7 swing move ‘w-x-y’. From there, an overlapping 5 wave structure is identified and a pullback initiates for wave ‘(b)’. Due to the nature of wave (i) down as a diagonal, we expect a 3,7 or 11 swing move down for wave ‘(iii)’. According to Elliott Wave theory, we are safe to assume an Elliott Wave zigzag structure move to complete wave ‘((iii))’; hence, the projected ‘(a)-(b)-(c)’ move .
Under our methodology, we do not take action with an unconfirmed ‘right side of the market’. In this particular example we have a confirmed ‘right side’ . This is represented by the “RightSide” arrow in red. So, we let the market shows itself and act when the price reaches extreme areas countering to the ‘right side’. As soon as wave (a) was confirmed, and an a-b swing is identified, we derived a 1:1 minimum target and a 1:1.618 extreme target. These targets are combined to provide a blue box target area where high probabilities favor the instrument to react from and very possibly resume the trend lower.
Coffee 03.27.2018 1 Hour Chart Elliott Wave Analysis
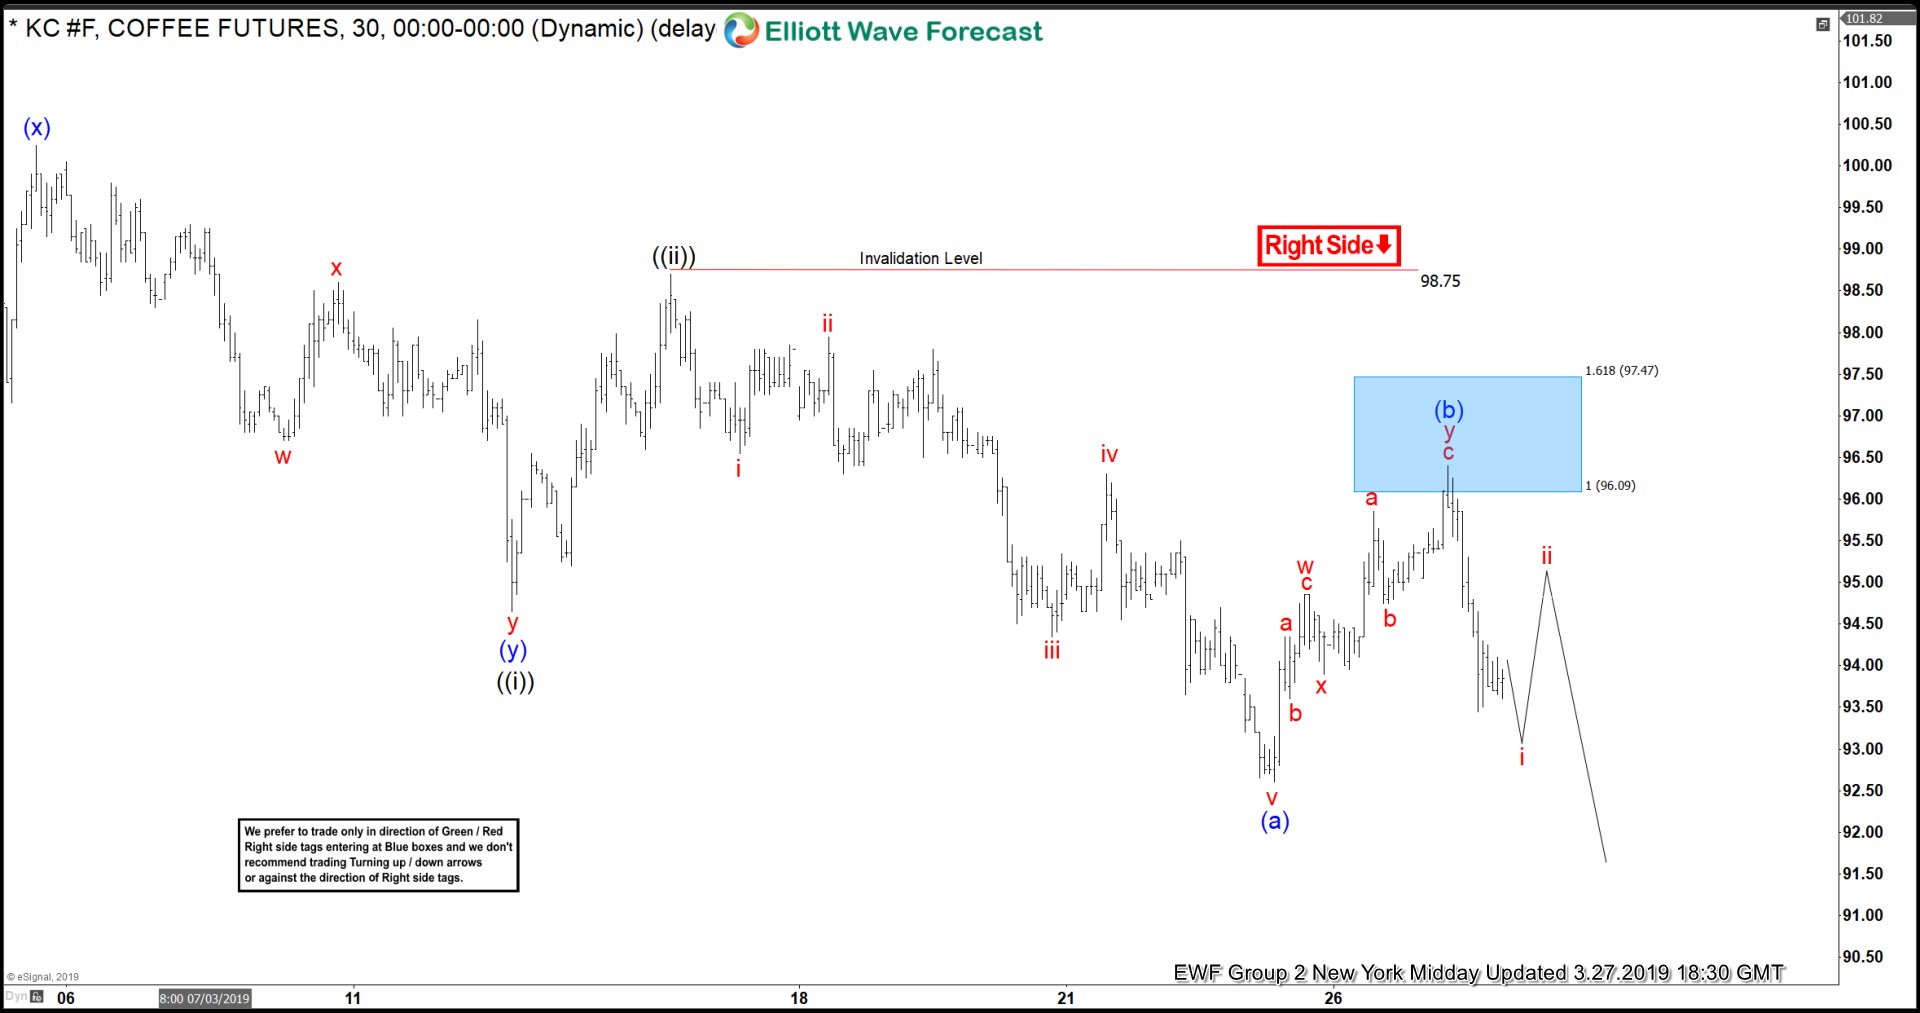
Below you will see an updated chart of coffee later on the same day. The bounce took the the structure of a 7 swing ‘w-x-y’ into the blue box, then coffee reacts and resumes the dominant trend. Our members were advised to take the short and were rewarded. Trading is always about taking a chance. But, what can be better than taking a chance with probabilities on your side. Now, we continue adapting and we wait for a new opportunity as the market repeats itself. Once again, our blue box target areas showing how accurate they can be. In the Live Trading Room, we have closed our short position from 96.08 blue box at 92.8 for a $3.28 profit.
Coffee 03.27.2018 1 Hour Chart Elliott Wave Analysis
*Note : Keep in mind the market is dynamic and the presented view might have changed after the post was published.
If you like what you read or if you are interested on our Elliott Wave theory application visit us at Elliott Wave Forecast. We cover 78 instruments in total for which we provide daily live analysis. Up-to-date Elliott wave analysis, and potential reversal target areas are always available. And if that was not enough, we provide support through a 24/7 chat room.