Patience is Paying Off for Traders that are Long XLP
After consolidating sideways for over two weeks XLP appears to be rewarding longs for their patience. Since 12/26/2018, XLP has risen from a low of $48.33 to its most recent high of $54.84 on 2/19/2019. This represents a 13.47% gain trough to peak. During that time the ETF developed a bullish sequence on the 1 hour time frame. Subscriber traders were then on alert for a trade with regards to our proprietary 1 hour cycle analysis.
Subscribers of ElliottWave-Forecast know this sequence analysis is an integral part of the process to recognize when and in what direction to initiate trades. This gives our traders the highest probability that they are entering not only on the right side in relation to the time frame but also entering at the extreme measurements. Entering at the extreme allows the best reward vs. risk. This plotting, mapping, and ultimately patience allows for more successful trading. We find the system paramount in executing a consistent repeatable process.
The Near Term Setup in XLP
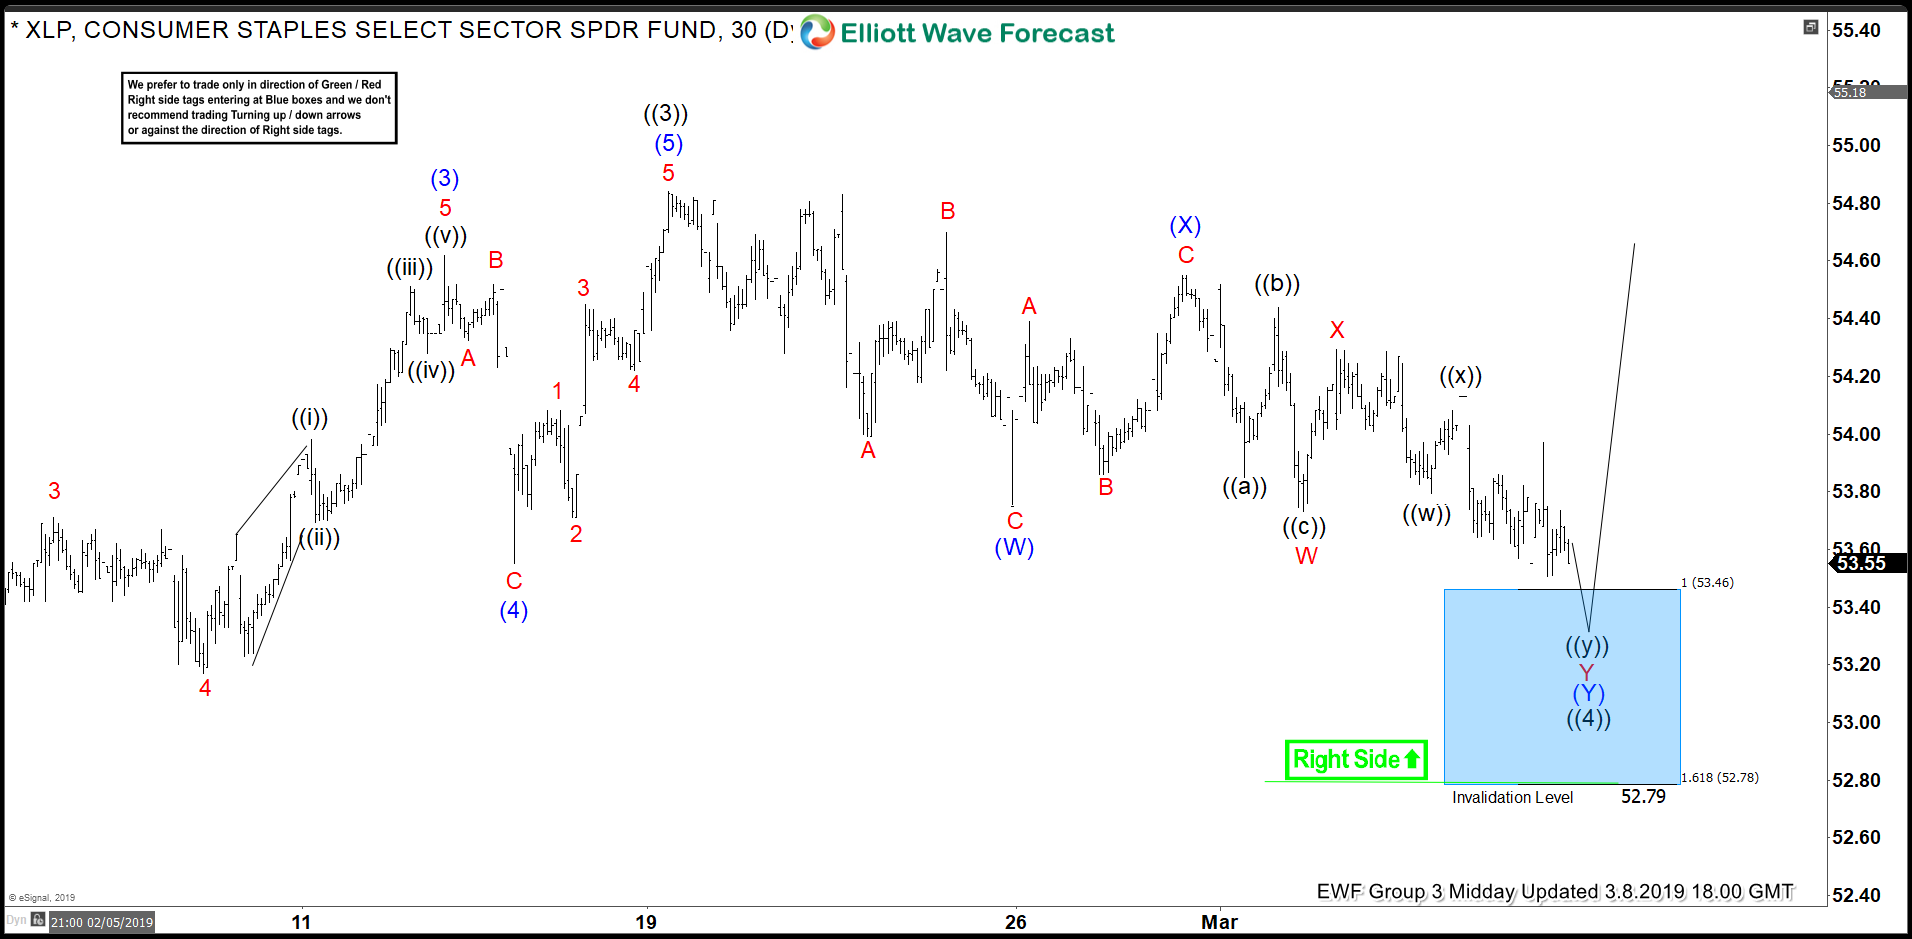
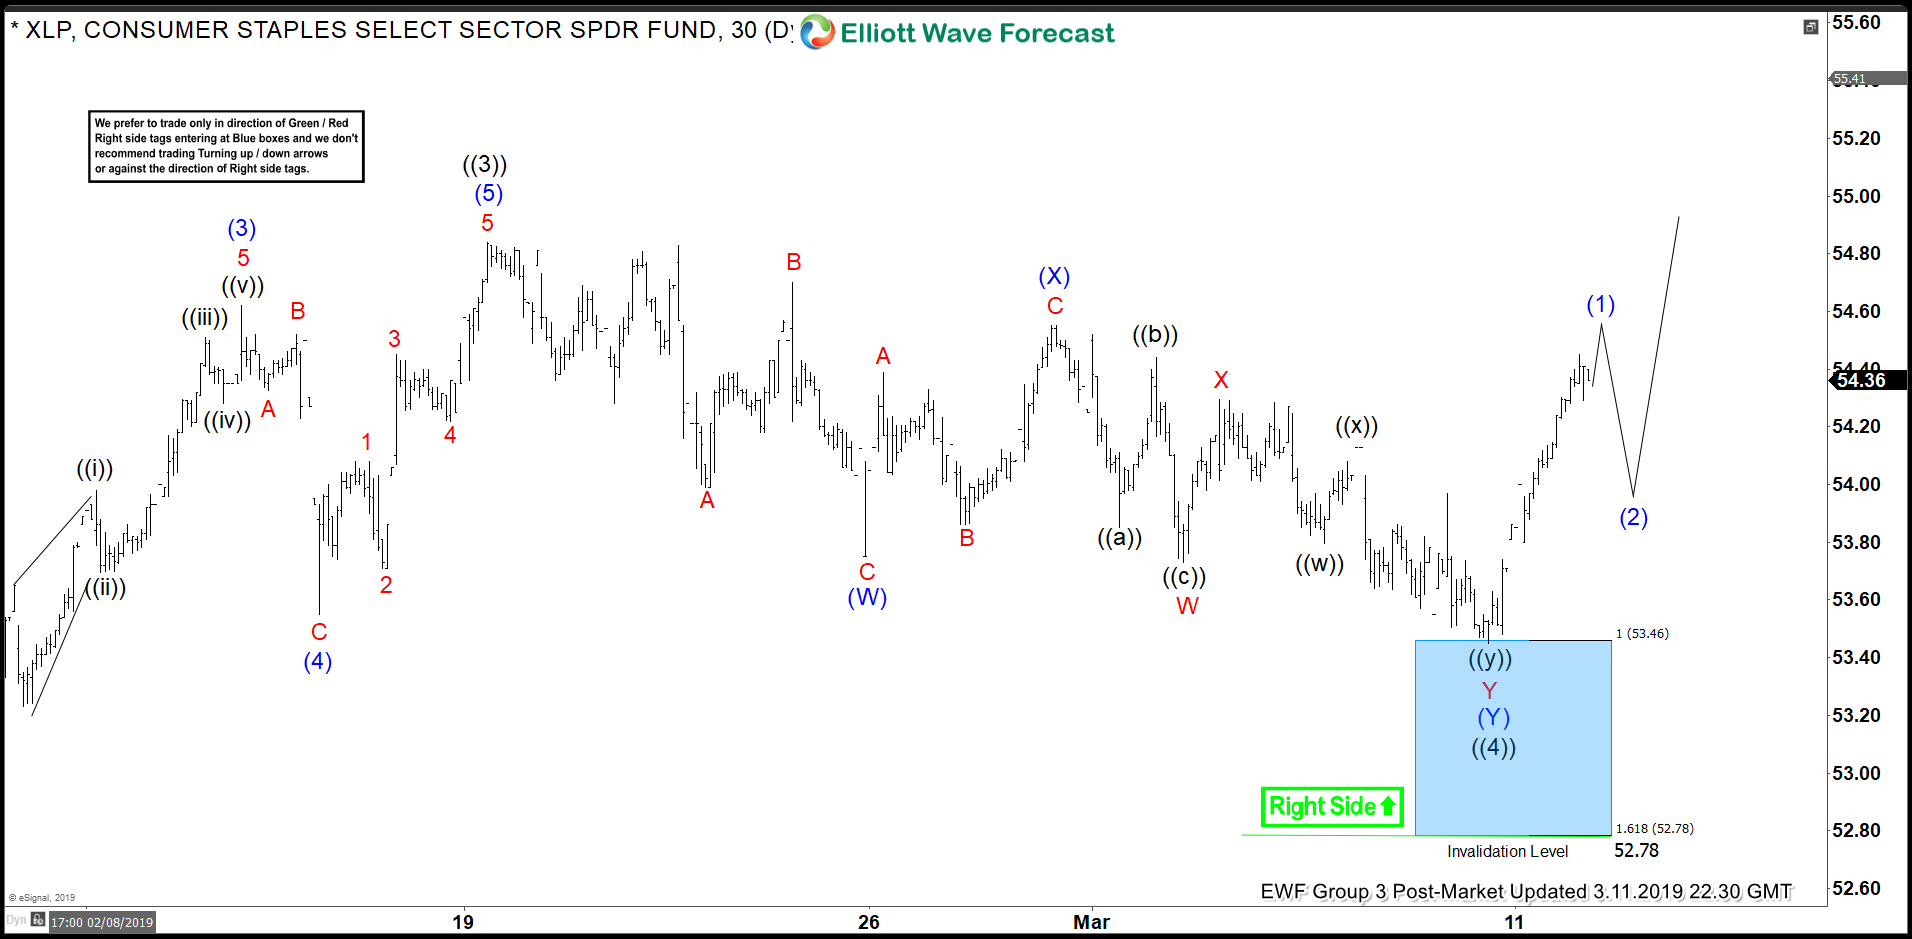
The plotting of the Elliott wave structure from the 2/19/2018 high suggests a corrective double-three structure in play. The labeling is (W) – (X) – (Y) in blue. A common relationship is that the length of (W) from the start of the correction ($54.84-$53.75 in this case) equals the projections for (Y) from the origin of (X). In more simpler terms, $54.84 – $53.75 or $1.09 = $54.55 – $1.09 or $53.46. Consequently the target for the end of (Y) and to complete the double-three correction from the above measurement is $53.46.
During our daily Group 3 Live Session on 3/8/2019 we were keen to suggest longs just above the $53.46 level at $53.50. As long as the invalidation level at $52.79 held the right side to trade was bullish. With a print of $53.45 on 3/8/2019 the trade is now live. Hence the follow up was how to manage the long in XLP going forward.
The Reaction