
Ishares Silver Trust (SLV) Larger Cycles and Elliott Wave
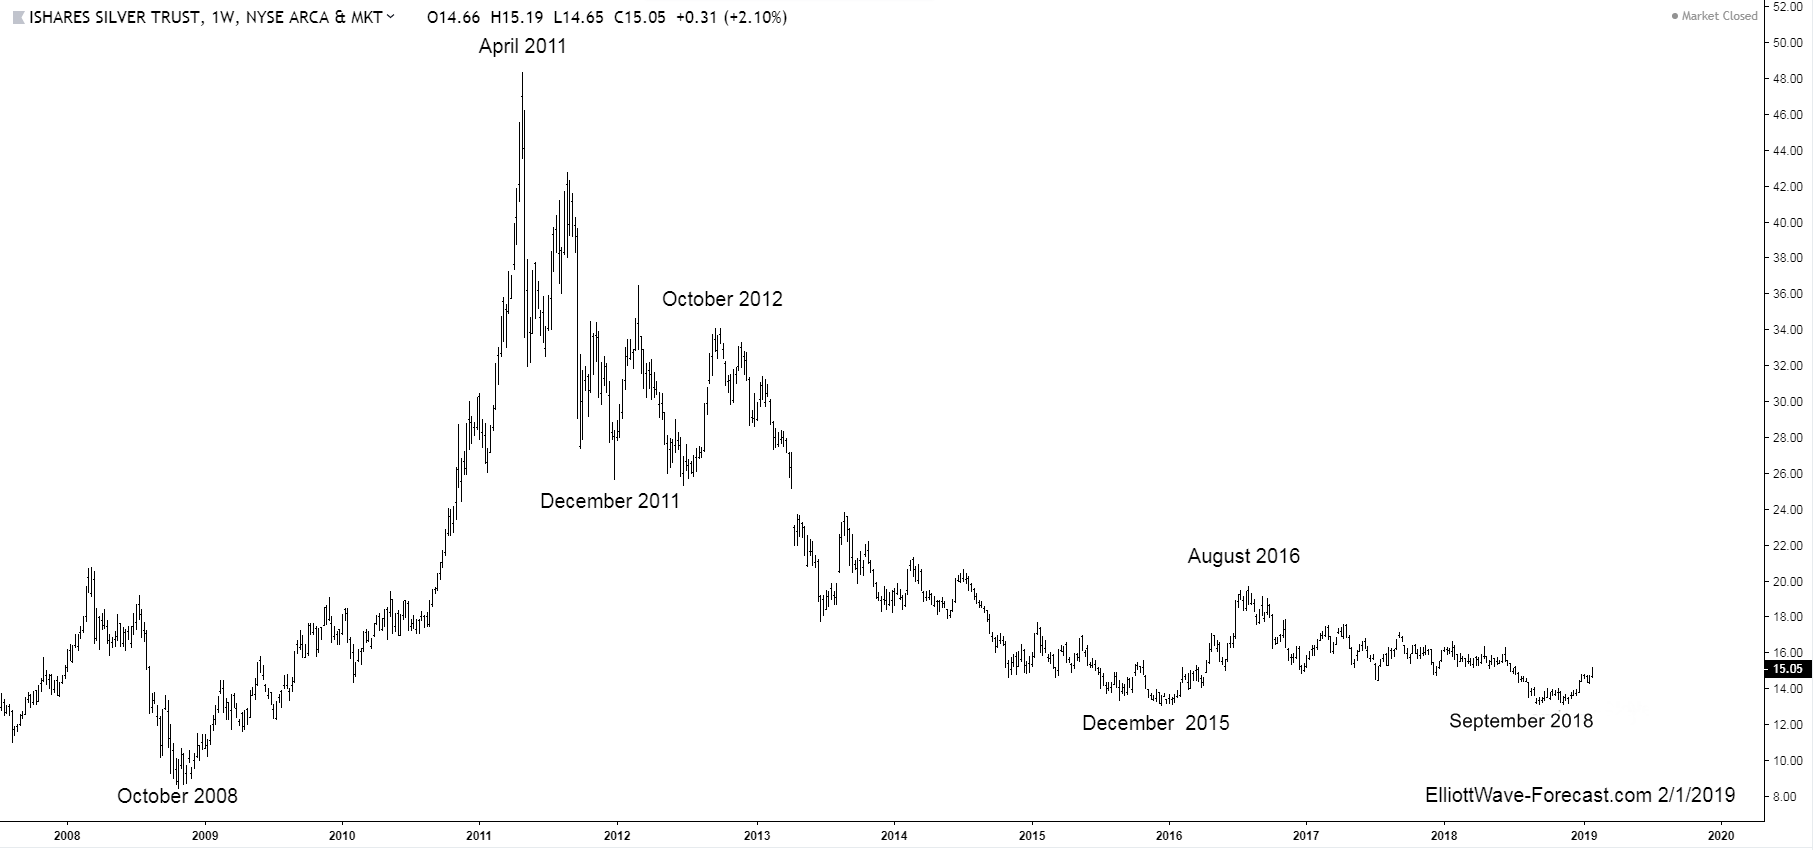
Firstly as seen on the weekly chart shown below. There is data back to when the ETF fund was started in 2006. Data suggests the fund made a low in 2008 that has not been taken out in price. There is no Elliott Wave count on that weekly chart. However you should be able to assume from the October 2008 lows to the April 2011 highs was a larger degree impulse.
Secondly, the decline from the April 2011 highs down to the December 2015 lows was three swings. Price held above the October 2008 lows. The bounce from the December 2015 lows to the August 2016 high was strong enough to end the cycle from the April 2011 highs. I presume the correction lower completed there.
The analysis continues below the weekly chart. Here is the SLV Weekly Chart.
Thirdly, the cycle from the April 2011 high appeared to have ended with the bounce to the August 2016 high. That bounce appeared to be a diagonal wave one of large degree. Here is where the daily chart shown below picks up with the Elliott Wave labeling. Next, the pull back lower is a pretty tough count. My best effort suggests it was a double three. The two waves of motive there, the black ((A)) & ((C)) were diagonal impulses separated in the connector wave ((B)). This is a complex double three (W)-(X)-(Y). The wave (Y) ended with a bearish triangle. The decline from the June 14, 2018 high ended on September 11th 2018 just above the lows from December 2015. The bounce from the September lows is strong. It ended the cycle from the August 2016 highs.
The analysis concludes below the daily chart. Here is the SLV Daily Chart.
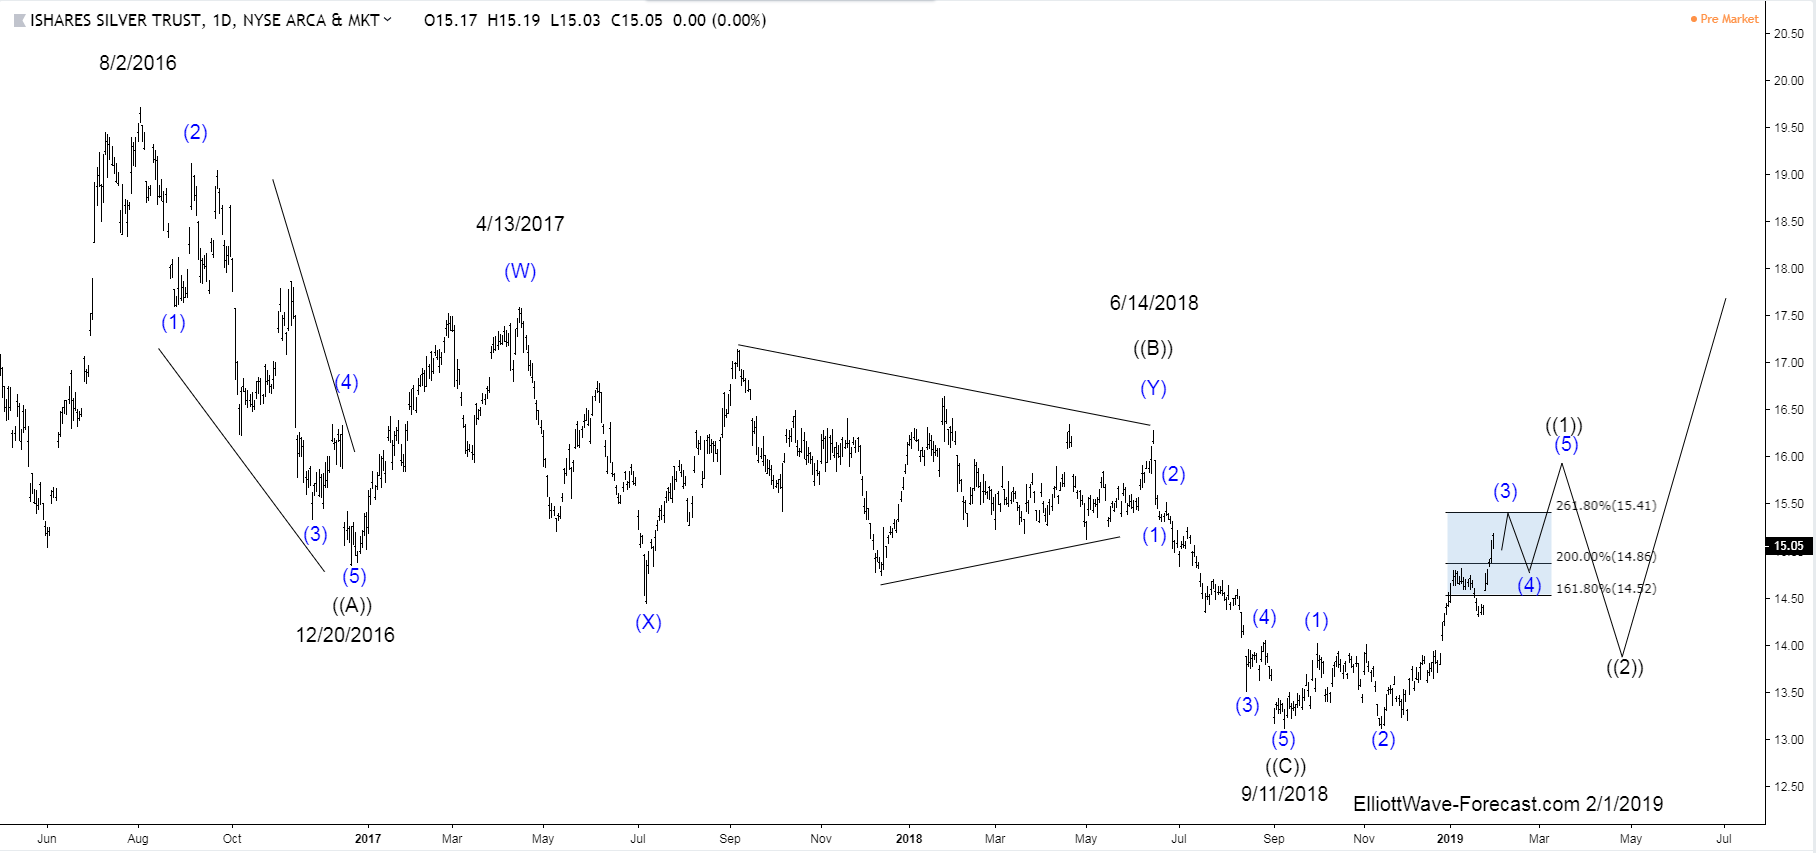
In conclusion, the bounce from the September 11, 2018 lows exhibits all qualities of an impulse in the black wave ((1)) thus far. However it is incomplete at this point and should go higher. A pullback in the smaller degree blue (4) when seen could retest or end either side of the January 22nd 2019 lows. It should see another high again afterward. However it is hard to pinpoint exactly where not knowing the blue (3) and (4) points at this time. Thus as of now it appears it would be around the 16.20 to 16.50 area. Next when it corrects the cycle from the September 2018 lows it will be expected to remain above there.
Thanks for looking.
Kind regards & good luck trading.
Lewis Jones