Hello fellow traders. In this technical blog we’re going to take a quick look at the charts of OIL published in members area of the website. As our members know, we were calling for decline in OIL from November 2018. As of right now the commodity is correcting the cycle from the 26.18 low. Proposed pull back is unfolding as Expanded Elliott Wave Flat Structure, when Oil still has scope to keep extending lower. We advised clients to avoid buying OIL and keep on favoring the short side. In the charts below, we’re going to explain the Elliott Wave structure and forecast.
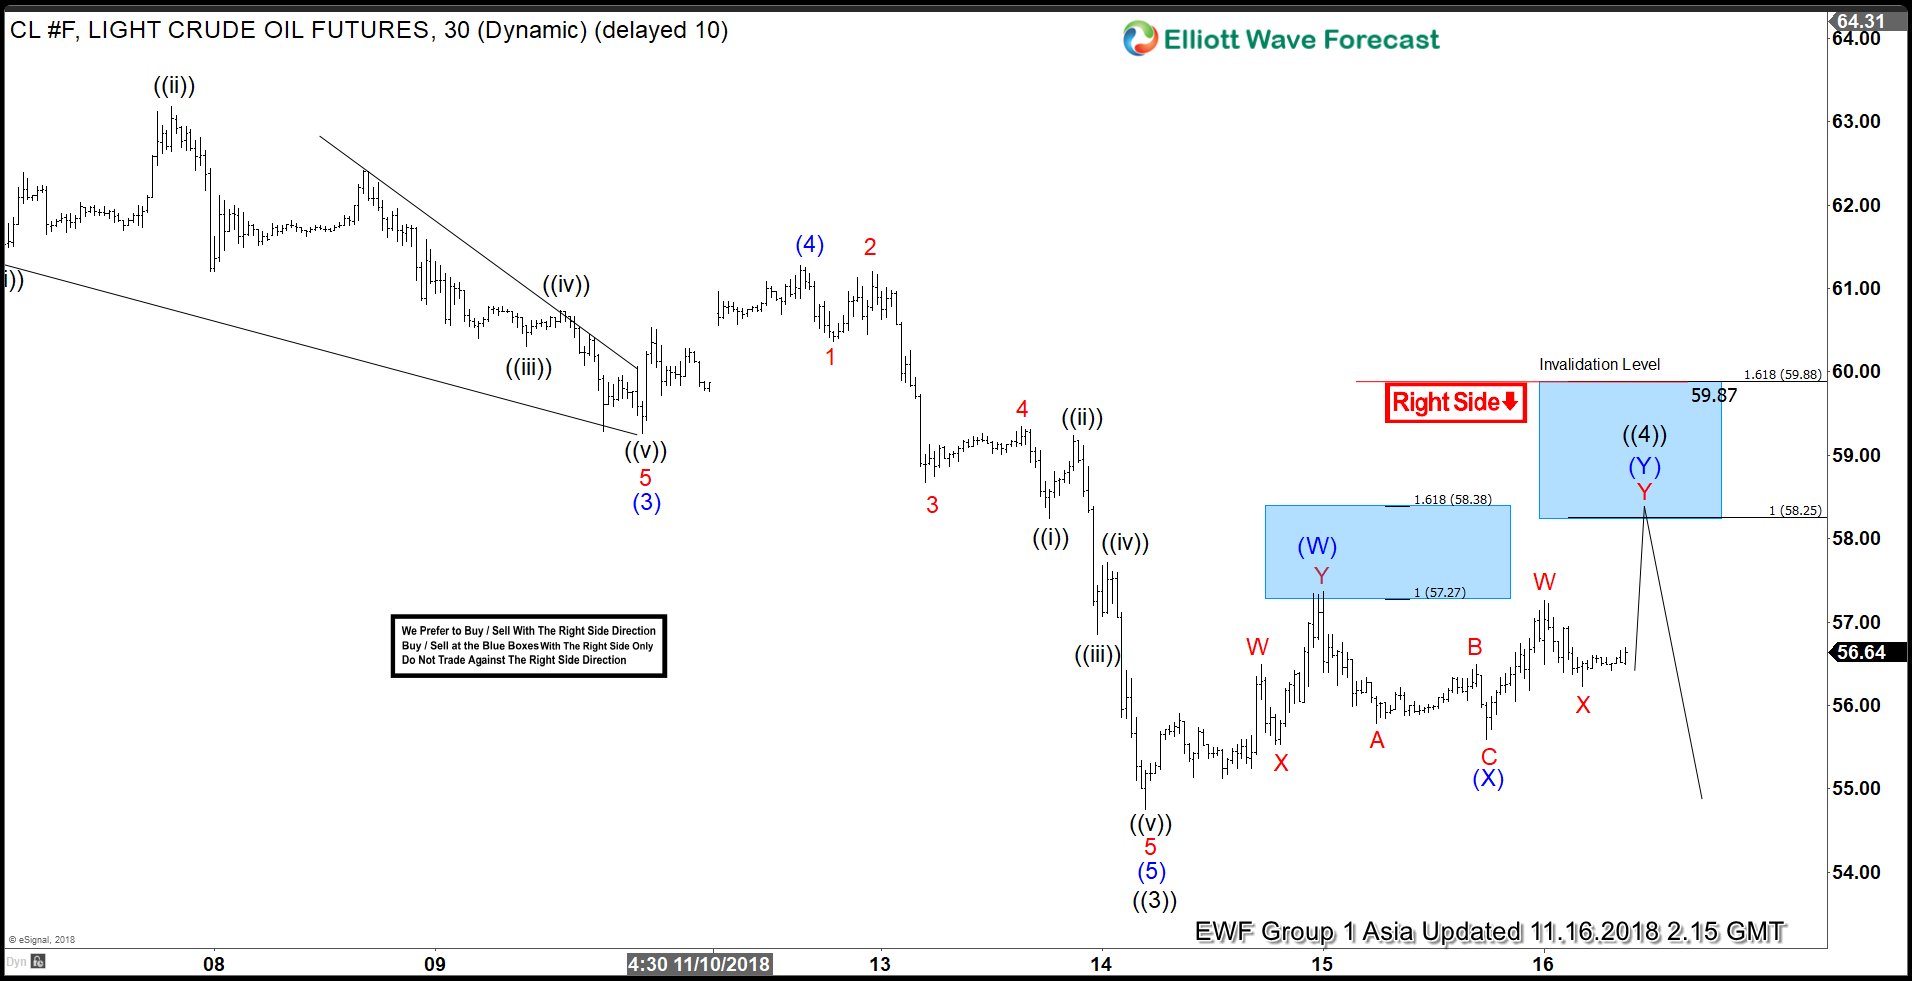
OIL Elliott Wave 1 Hour Asia Chart 11.16.2018
As we can see at the charts below OIL is doing short term recovery that is unfolding as Elliott Wave double three pattern. It’s expected to make another leg up to complete 7 swings in proposed bounce. Recovery has scope to reach 58.25 + area ( blue box) , where we would like to be sellers. We recommended members to avoid buying OIL and keep selling short term rallies in 3,7,11 swings for further downside. Stop Loss of the trade is a break above 1.618 Fibonacci extension (59.87)
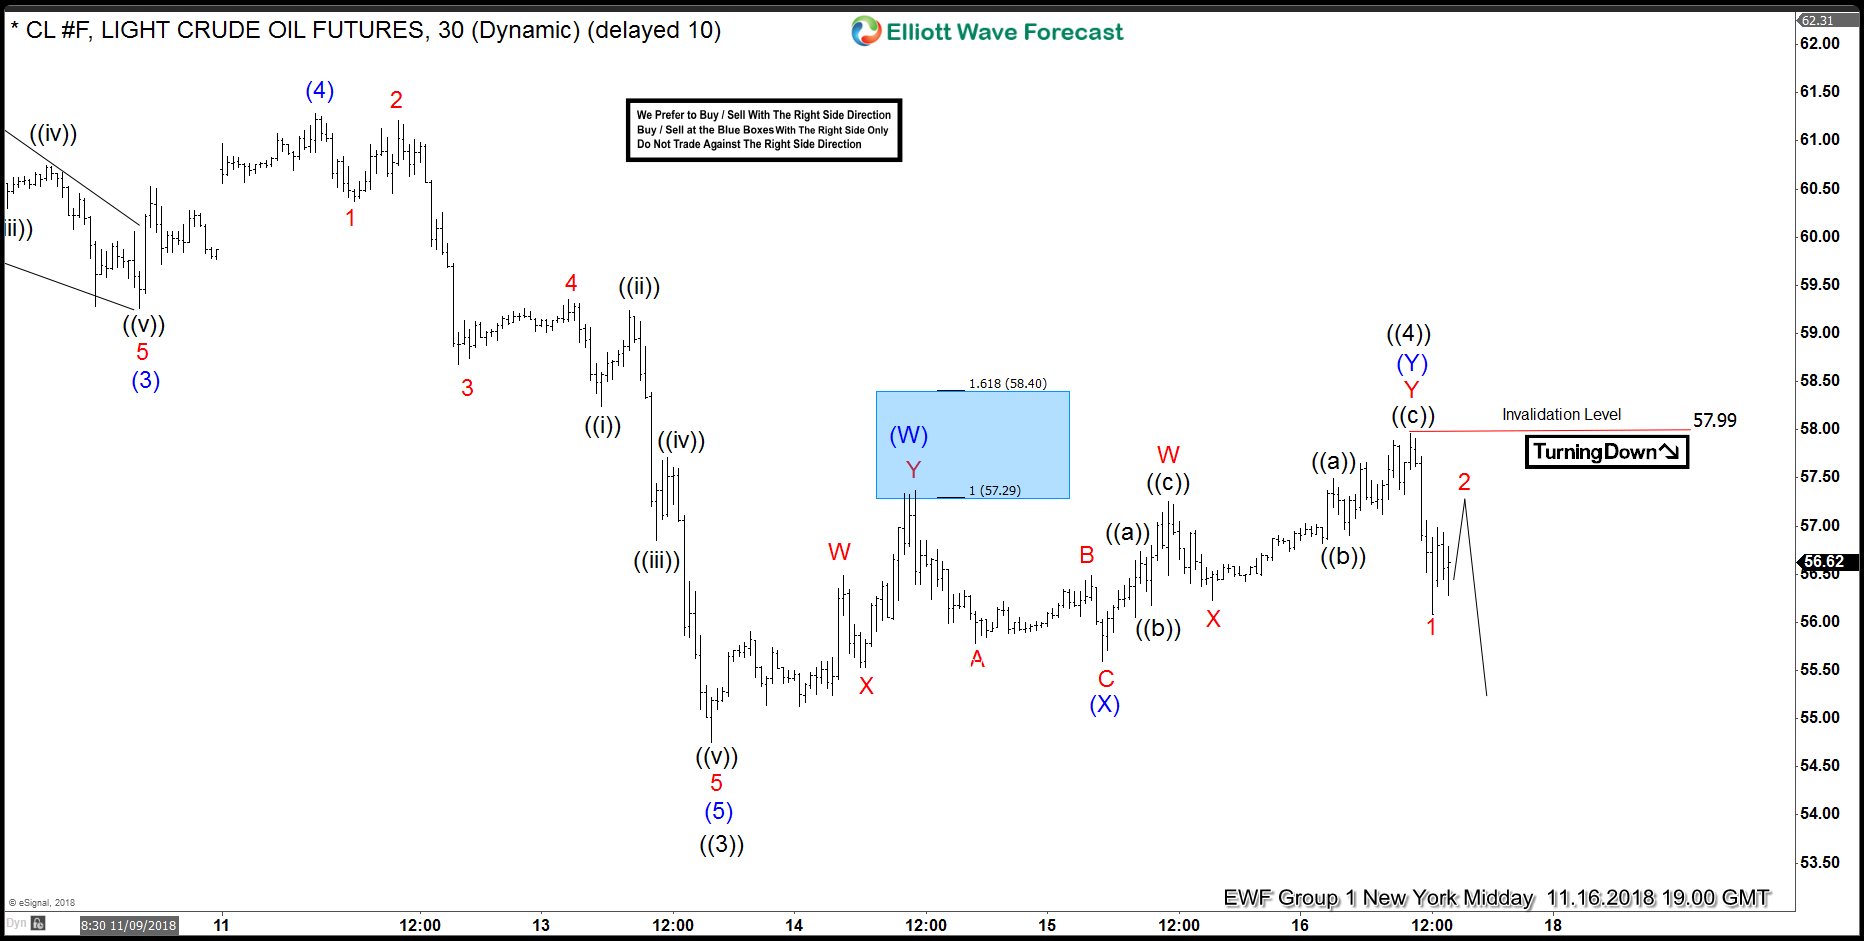
OIL Elliott Wave 1 Hour New York Midday Chart 11.16.2018
We got the proposed leg up , 7th swing as expected. However sellers appeared early and pushed the price down before proposed area was reached. The price has missed blue box by a few points. Now wave ((4)) recovery looks completed at 57.99 high, and we are calling for further weakness. We need to see break of previous low to confirm next leg down is in progress.
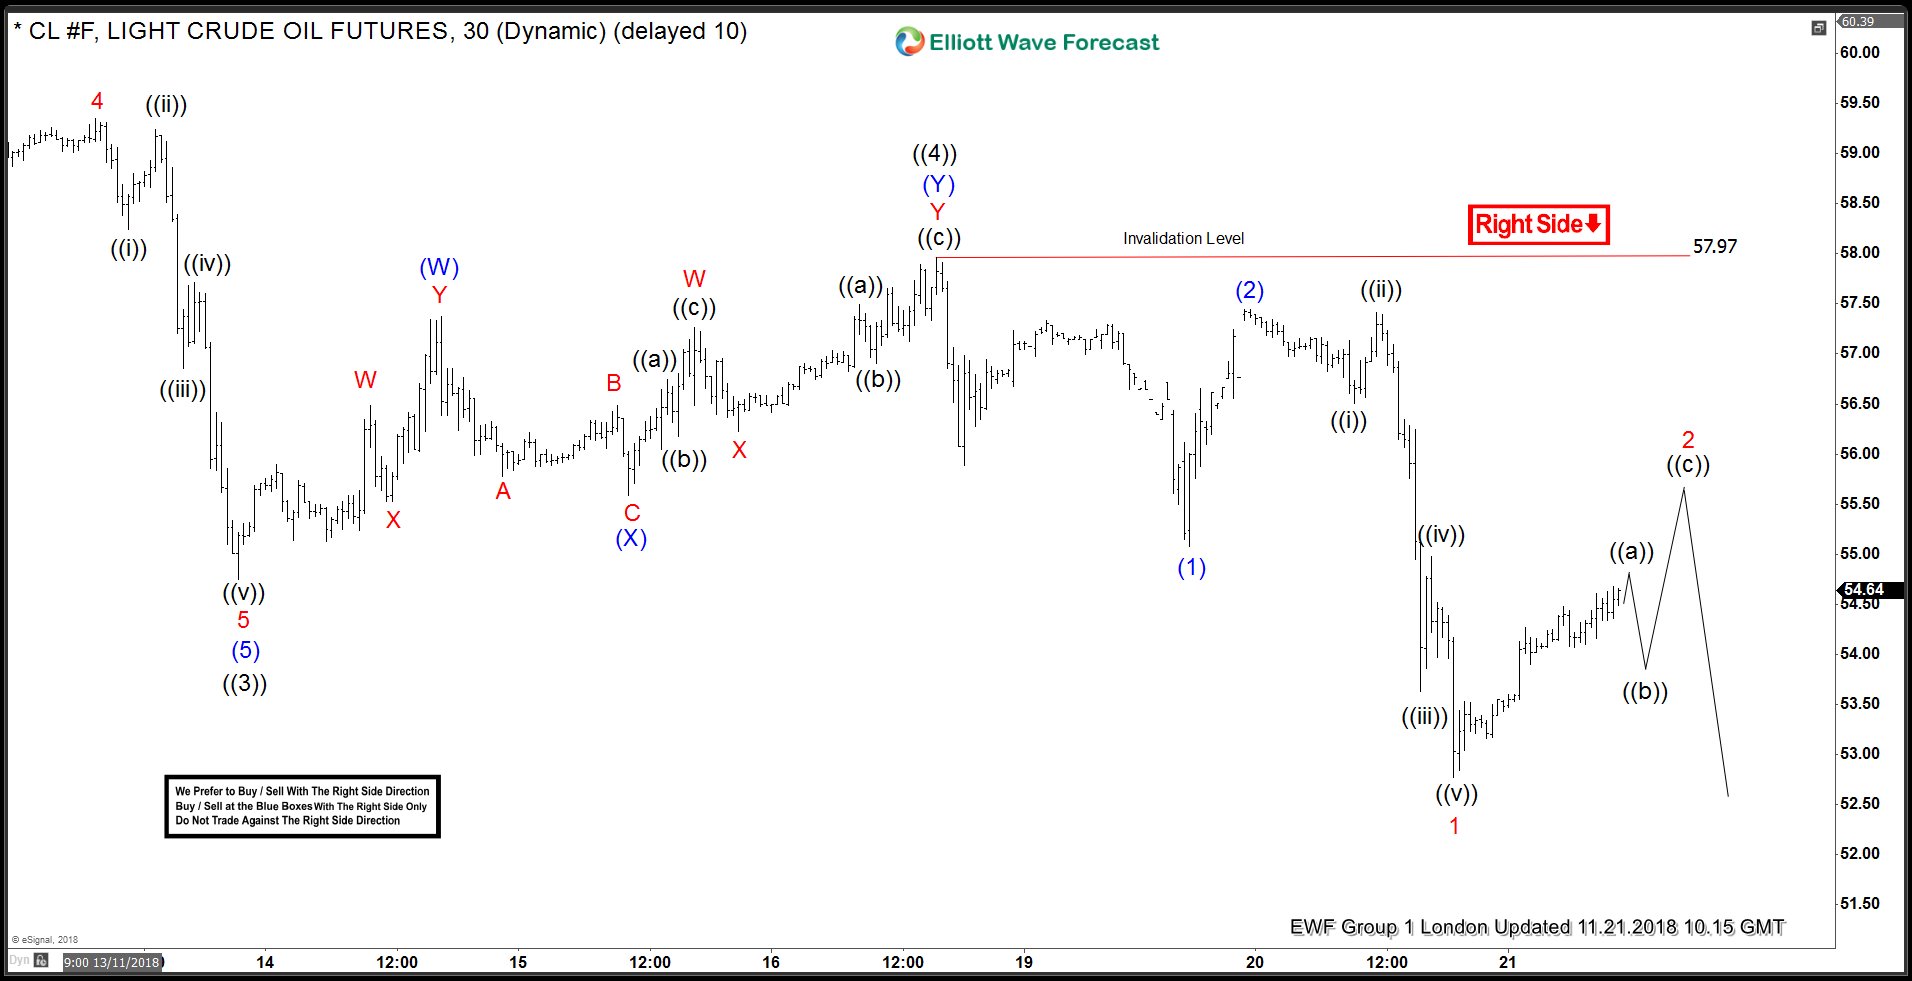
OIL Elliott Wave 1 Hour London Chart 11.21.2018
The price has held below 57.99 peak and we got proposed decline. Eventually OIL has made new short term low, confirming next leg down is in progress. Now the commodity has opened new cycle to the downside and it can be sold in 3,7,11 swings against the 57.99 peak. We don’t advise buying OIL and favor the short side against the 57.99 peak.
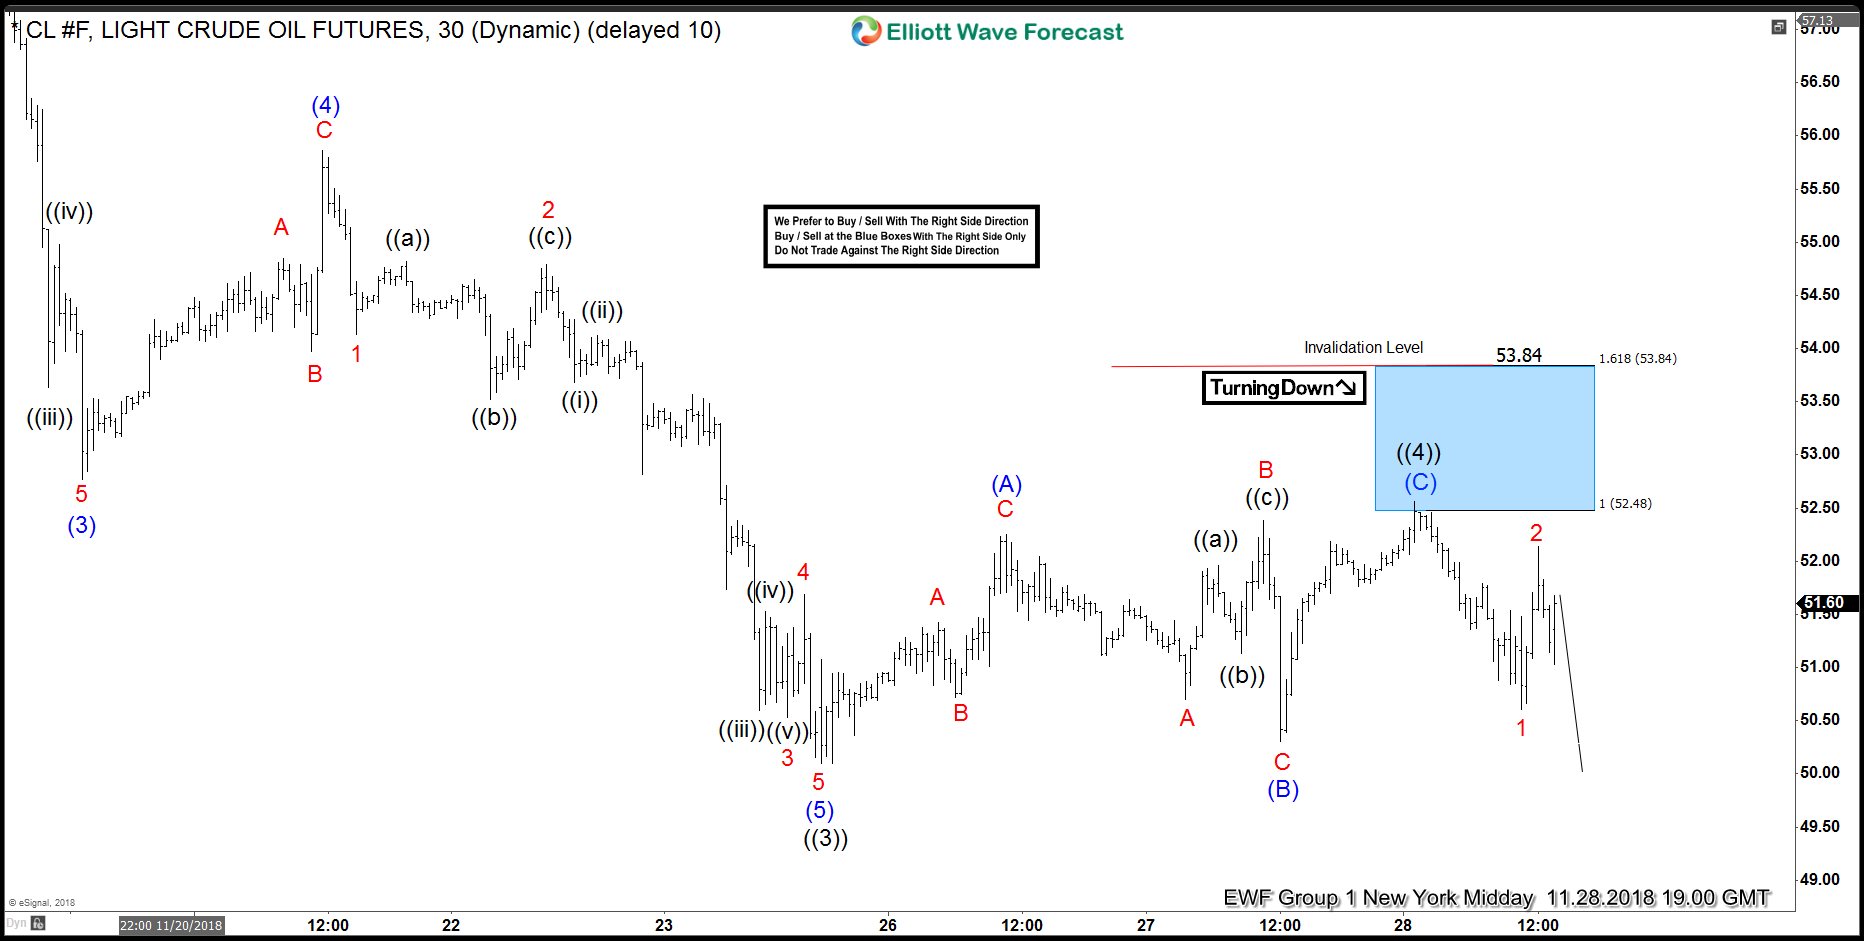
OIL Elliott Wave 1 Hour Chart 11.28.2018
The price has held invalidation level at 57.99 and we got a nice decline as expected. Short term recovery wave ((4)) has reached its equal legs at 52.48. It found sellers immediately and gave us nice reaction from the blue box. Members who are in short positions from there should be already risk free. We are calling wave ((4)) recovery completed.
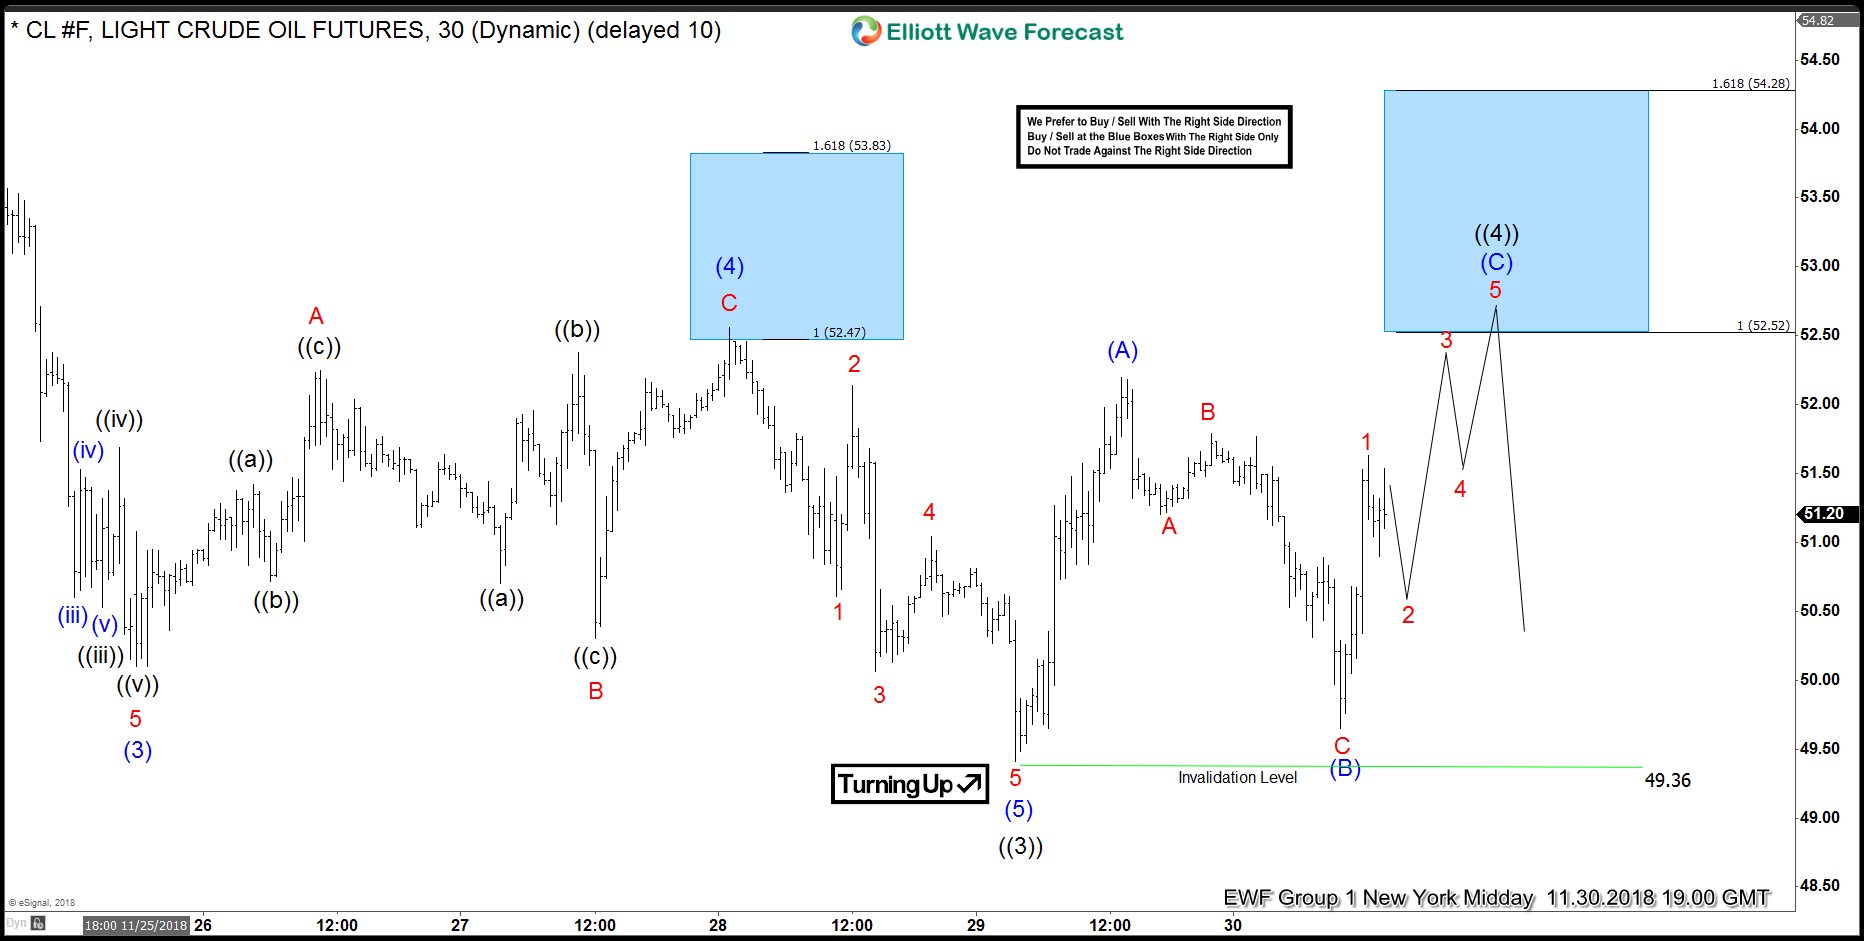
OIL Elliott Wave 1 Hour Chart 11.30.2018
We got new low in OIL, however buyers are also strong at this stage and we’re getting choppy price action. We see possibilities of more short term strength toward 52.52-54.28 area
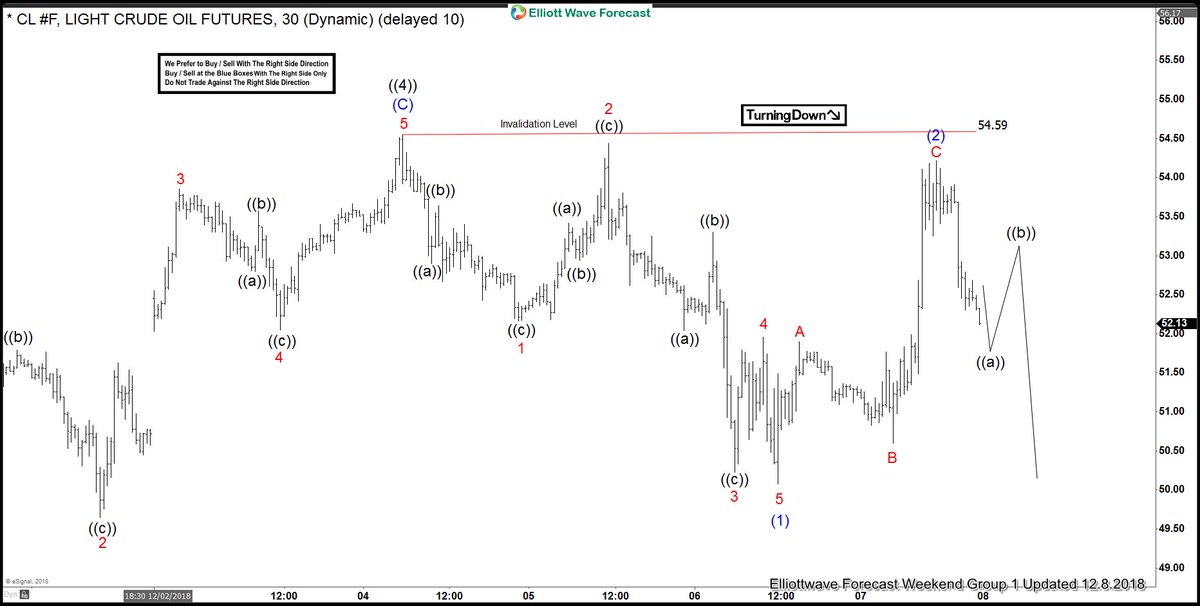
OIL Elliott Wave 1 Hour Chart 12.08.2018
Wave ((4)) recovery has taken form of Elliott Wave Flat pattern and completed at 54.59 . Now as far as the price holds below 54.59 peak, we expect further decline.
Keep in mind market is very dynamic and proposed view could have ended in the mean time. Best instruments to trade are those having incomplete bullish or bearish swings sequences. We put them in Sequence Report and best among them are shown in the Live Trading Room.