
Hello fellow traders. In this technical blog we’re going to take a quick look at the charts of RUSSELL published in members area of the website. As our members know, RUSSELL has incomplete sequences in the cycle from the August 31th 2018 peak. Break of October 24th low, has made 31th August cycle incomplete to the downside. The index is still missing more short term weakness to complete proposed August cycle, targeting 1298.5 area. Consequently , we expect the Index to find sellers in 3,7,11 swings sequences. We advised clients to avoid buying RUSSELL and keep on selling the rallies when given the opportunity. In the charts below, we’re going to explain the Elliott Wave structure, forecast and trading strategy.
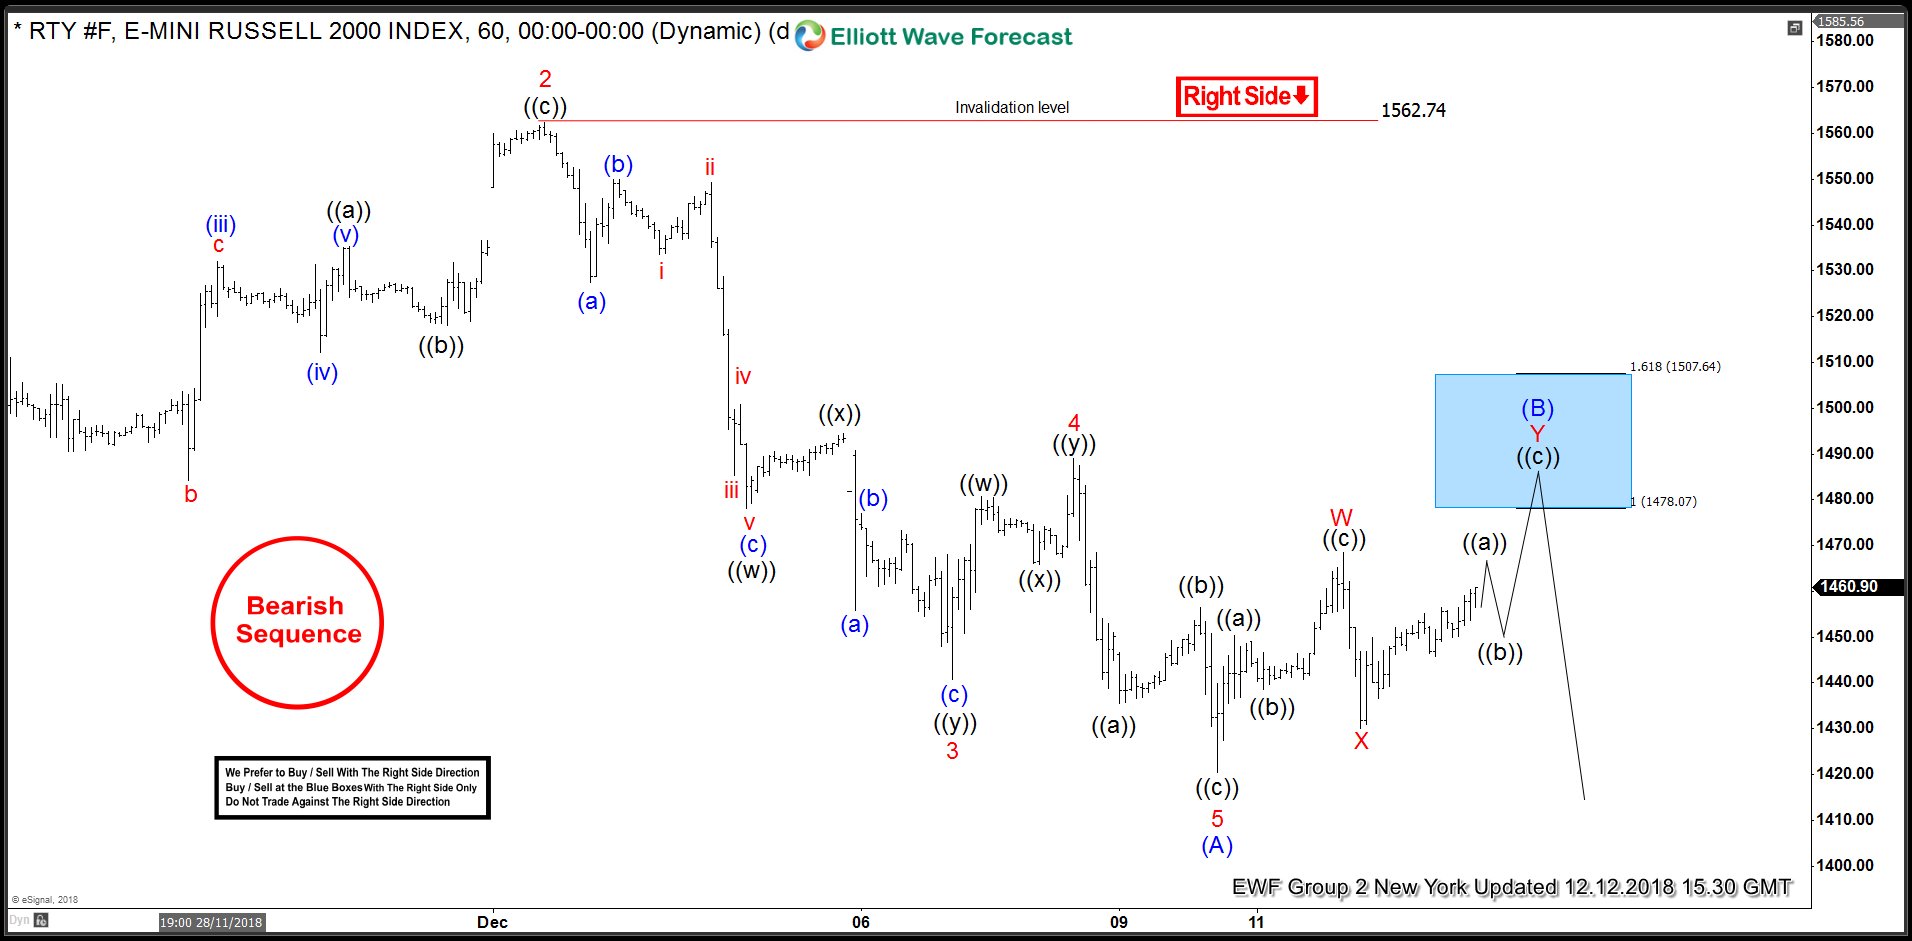
RUSSELL Elliott Wave 1 Hour Chart 12.12.2018
As we can see at the charts below, RUSSELL is bearish against the 1562.74 peak in first degree. Proposed short term bounce seems to be unfolding as a Elliott Wave Double Three pattern. Recovery has scope to make another leg up toward 148.07 area, where we would like to be sellers against the 1562.7 peak. We recommended members to sell RUSSELL at the blue box (1478.07-1507.64) for further downside. As we have incomplete bearish sequences in August cycles, we expect sellers to appear at that area for further delcine ideally or 3 wave pull back alternatively. Stop Loss of the trade is a break above 1.618 Fibonacci extension (1507.64)
RUSSELL Elliott Wave 1 Hour Chart 12.17.2018
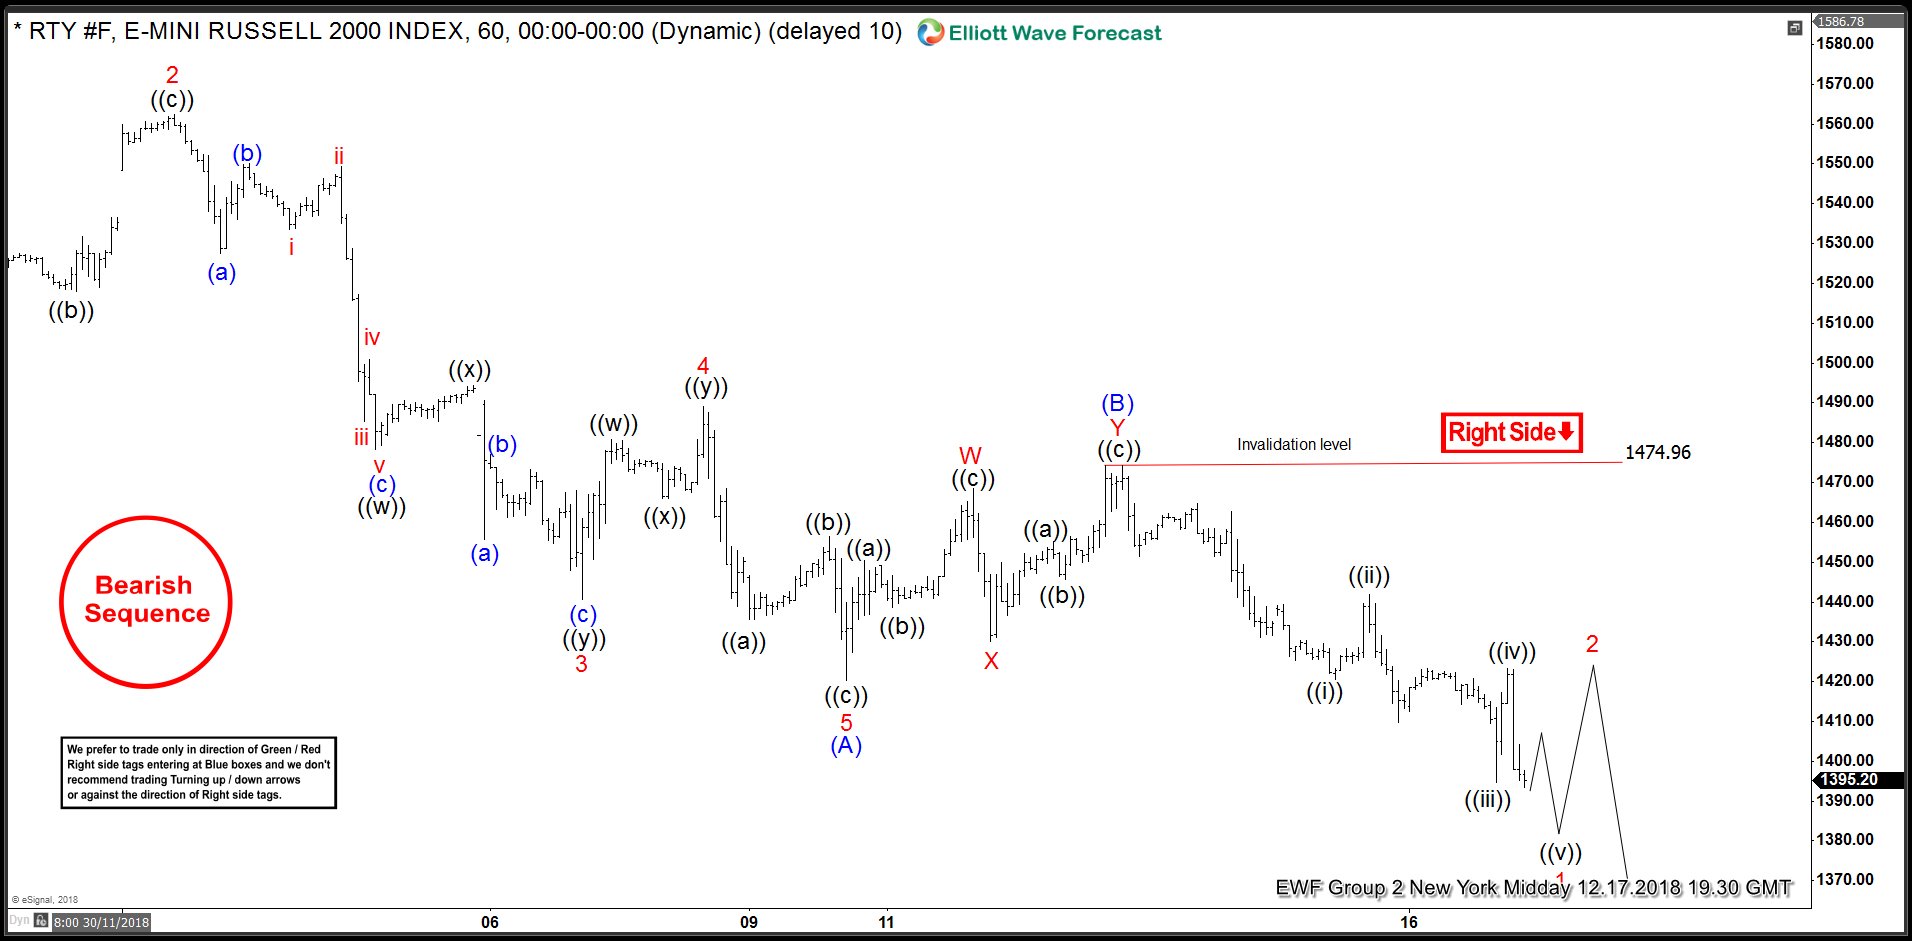
RUSSELL has made swing up as forecasted, however unfortunately it missed blue box:1478.07 by a few points. Sellers appeared early and short term recovery ended as truncation at 1474.7. The Index has given us the decline , making new short term low. Now RUSSELL is bearish against the as far as the 1474.7 peak in first degree. As far as that pivot holds , next leg down is in progress. Alternatively if during short term bounces mentioned pivot gives up, we can be doing Elliott Wave Flat pattern against the 1562.7 pivot
Keep in mind marked is very dynamic and proposed view could have ended in the mean time. You can check most recent updates in the Membership Area of the Website Best instruments to trade are those having incomplete bullish or bearish swings sequences. We put them in Sequence Report and best among them are shown in the Live Trading Room.