Hello fellow traders. In this technical blog we’re going to take a quick look at the past Elliott Wave charts of CADJPY published in members area of The Website. As our members know CADJPY has the incomplete bearish sequences in the cycle from the October 3th peak. Break of 10/26 low has made the pair bearish against the 86.99 peak, suggesting further decline . We knew the price should find sellers in bounces in 3,7,11 swings. So ,we advised members to avoid buying the pair and keep on selling the rallies in the sequences of 3,7,or 11 swings whenever get chance. In further text we’re going to talk more about the Elliott Wave Forecast.
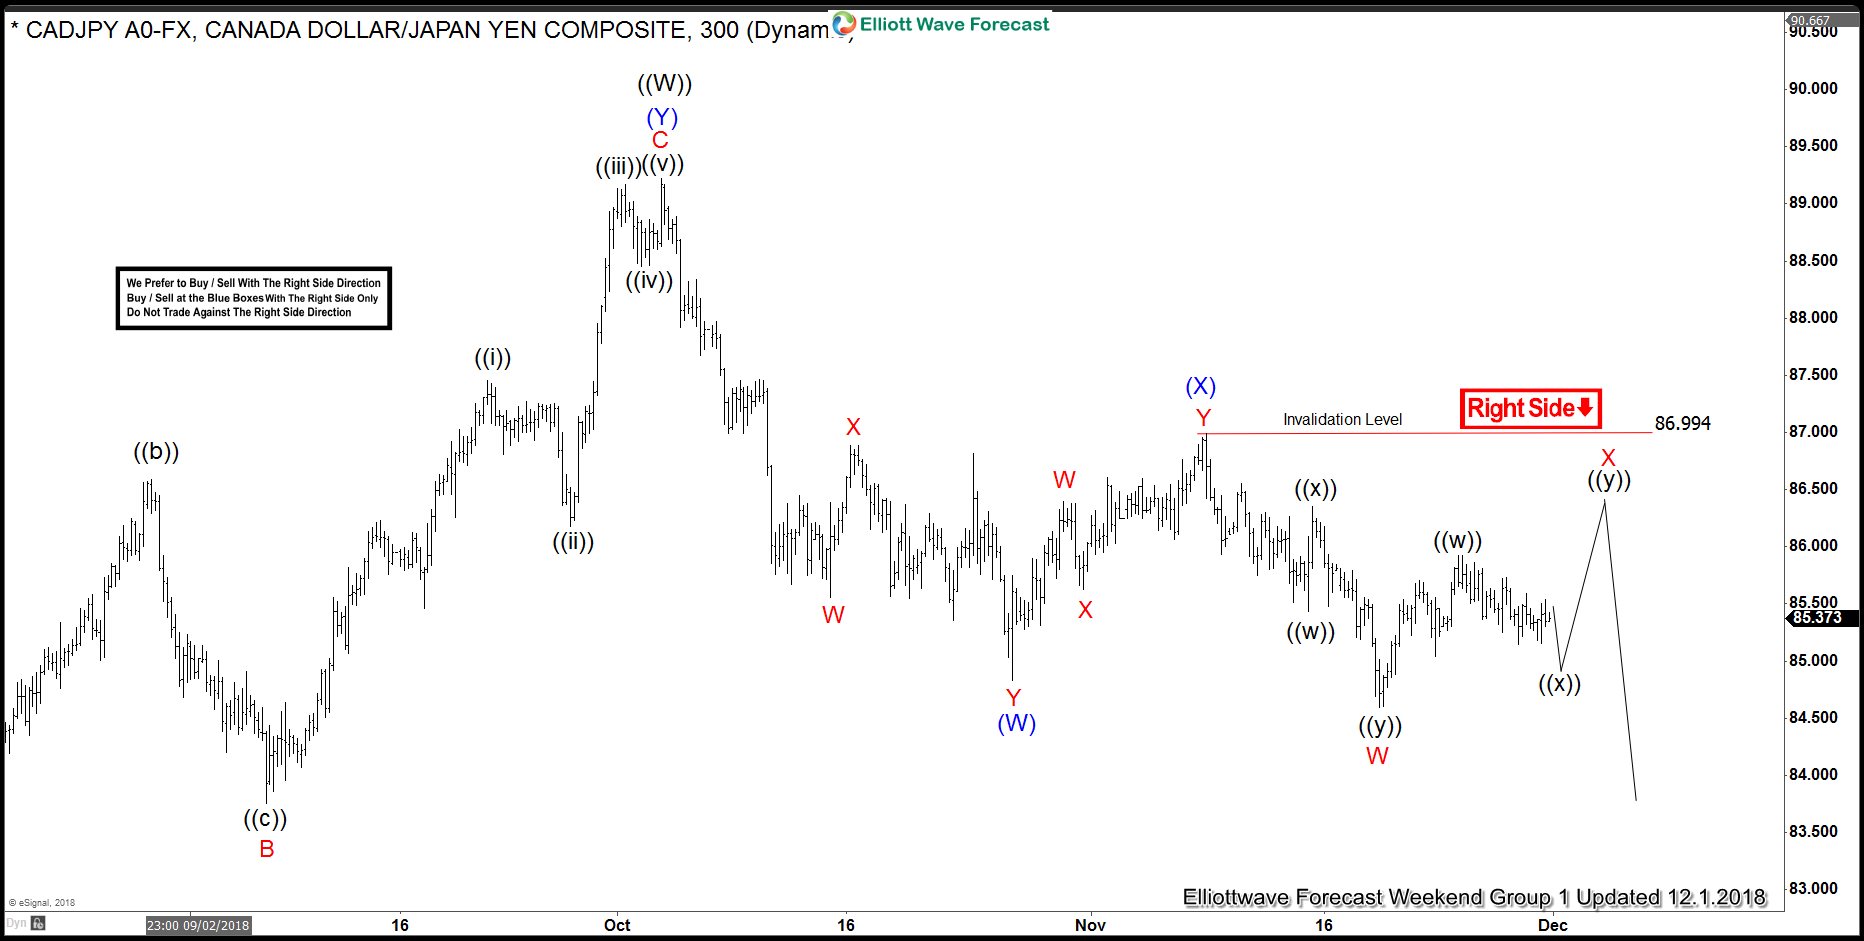
CADJPY 4 Hour Elliott Wave Analysis 12.1.2018
As of right now, the pair is correcting cycle from the 86.99 peak. Currently the pair is correcting the cycle from the 86.99 peak, doing Elliott Wave Double Three Pattern. We’re looking for another swing up , wave ((y)) to complete X red connector. We don’t advise buying the pair in proposed swing up, and favor the short side. As far as 86.99 pivot holds, we expect sellers to appear for further decline ideally or 3 wave pull back alternatively.
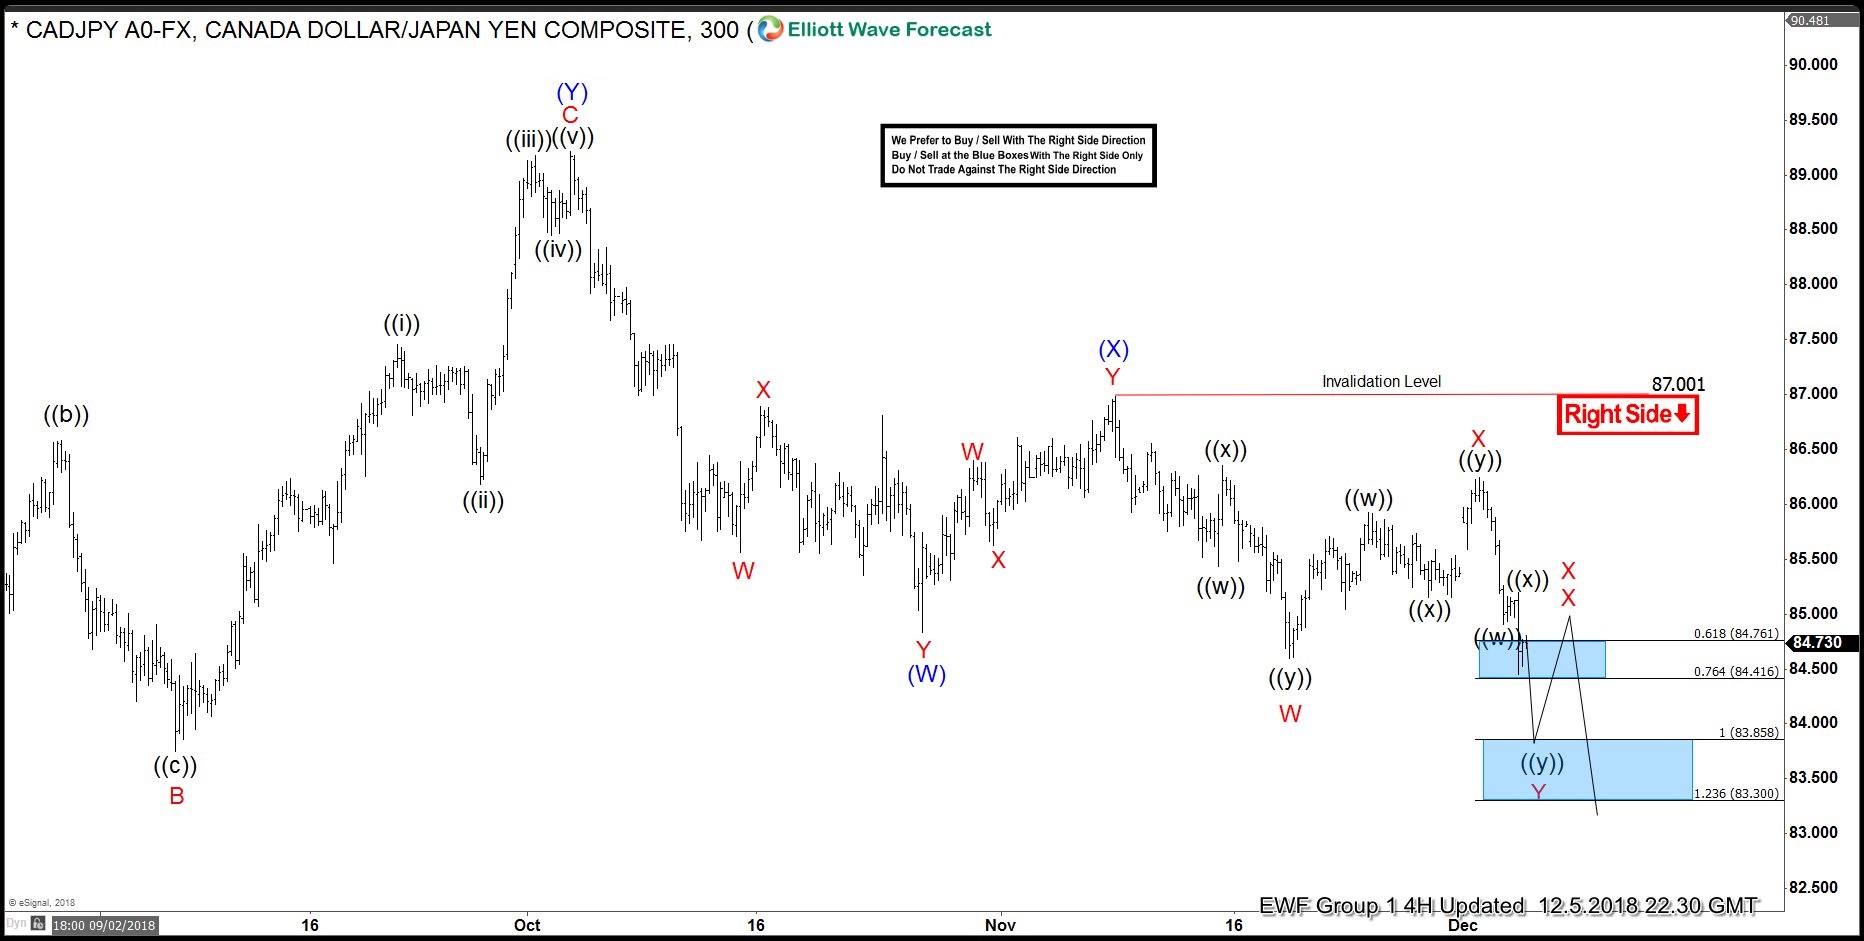
CADJPY 4 Hour Elliott Wave Analysis 12.5.2018
The pair has held 86.99 pivot in place, and we got nice decline after X red connector completed. During the decline the price broke 11/20 low, making the cycle from the 87.00 peak incomplete as well. Now the pair is targeting 83.85-83.30 area next, where sellers will be taking profits. We expect to see 3 wave bounce from the mentioned area, that should offer new selling opportunities in the pair. Although bounce is expected, we advise members to avoid buying the pair and to wait for clear bounce, before selling short term rallies in 3,7,11 swings against the 86.25 pivot in first degree.
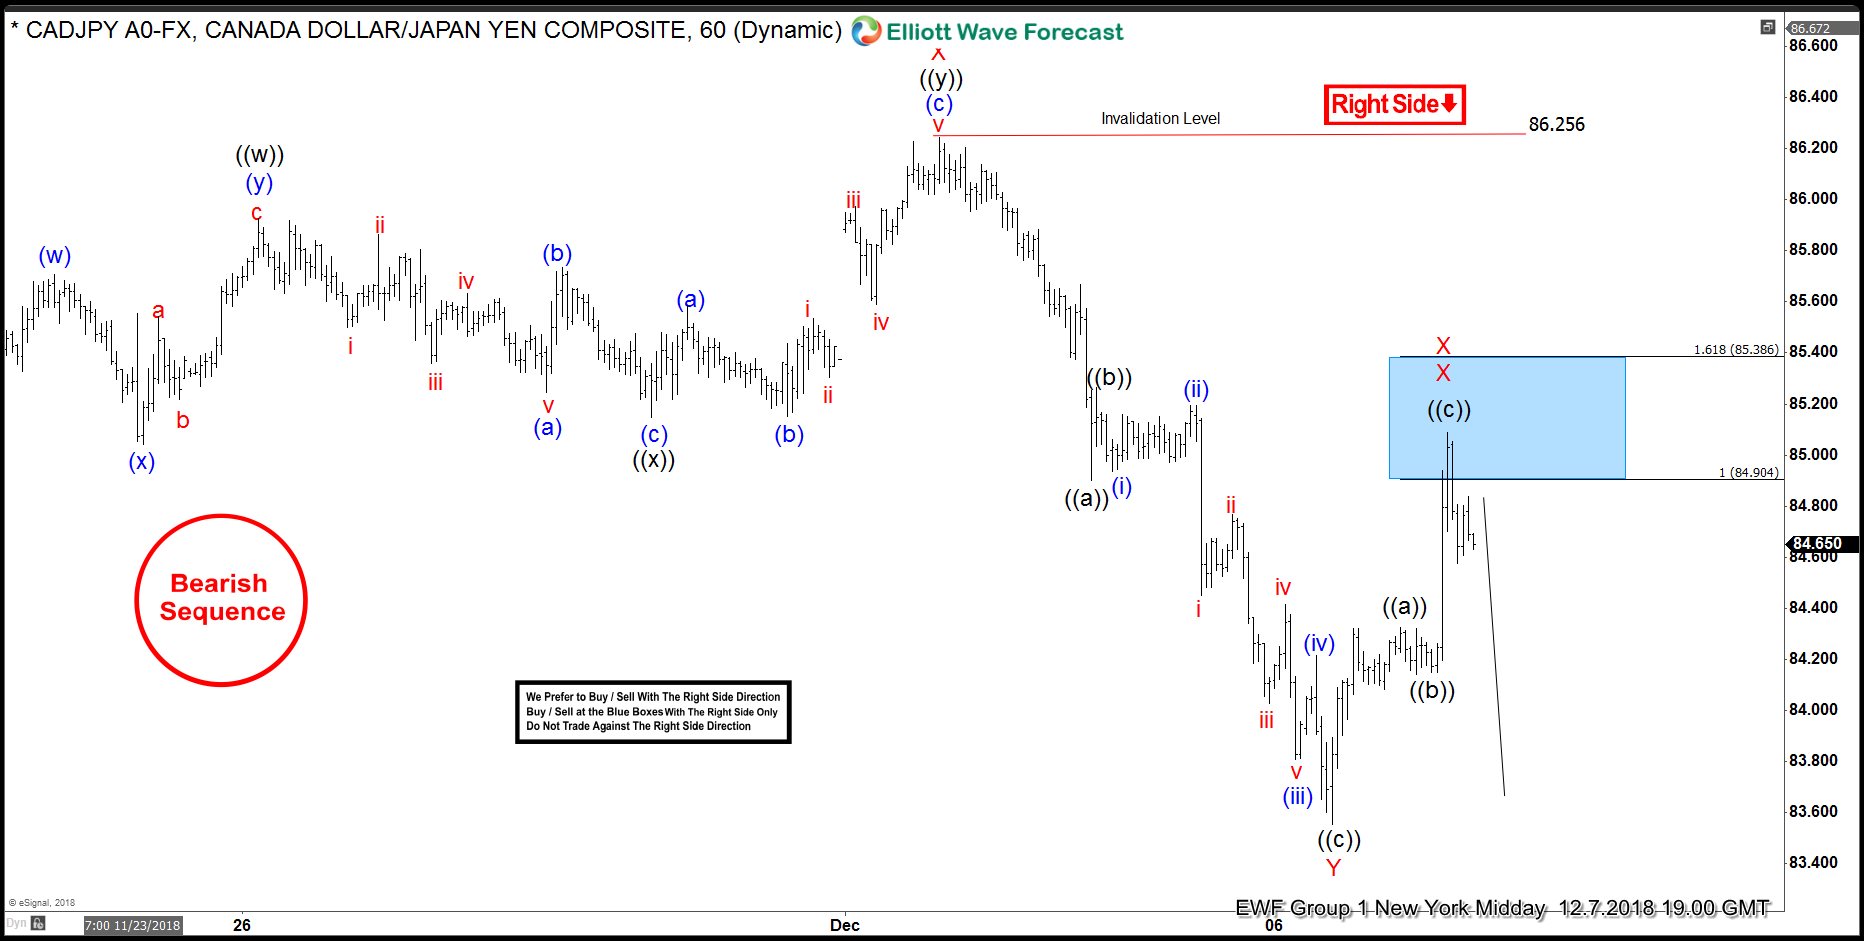
CADJPY 1 Hour Elliott Wave Analysis 12.7.2018
Eventually we got the proposed bounce from the blue box area :83.85-83.30 as expected. Short term connector made clear 3 waves and reached its equal legs area at 84.9-85.38 ( sell zone). We are already getting reaction from there. As soon as the decline reaches 50 Fibs against the ((b)) low, we should make our short positions risk free.
Note : Keep in mind market is dynamic and presented view could have changed in the mean time. Best instruments to trade are those having incomplete bullish or bearish swings sequences. We put them in Sequence Report and best among them are shown in the Live Trading Room.