
CADJPY Technical Analysis December 10/2018
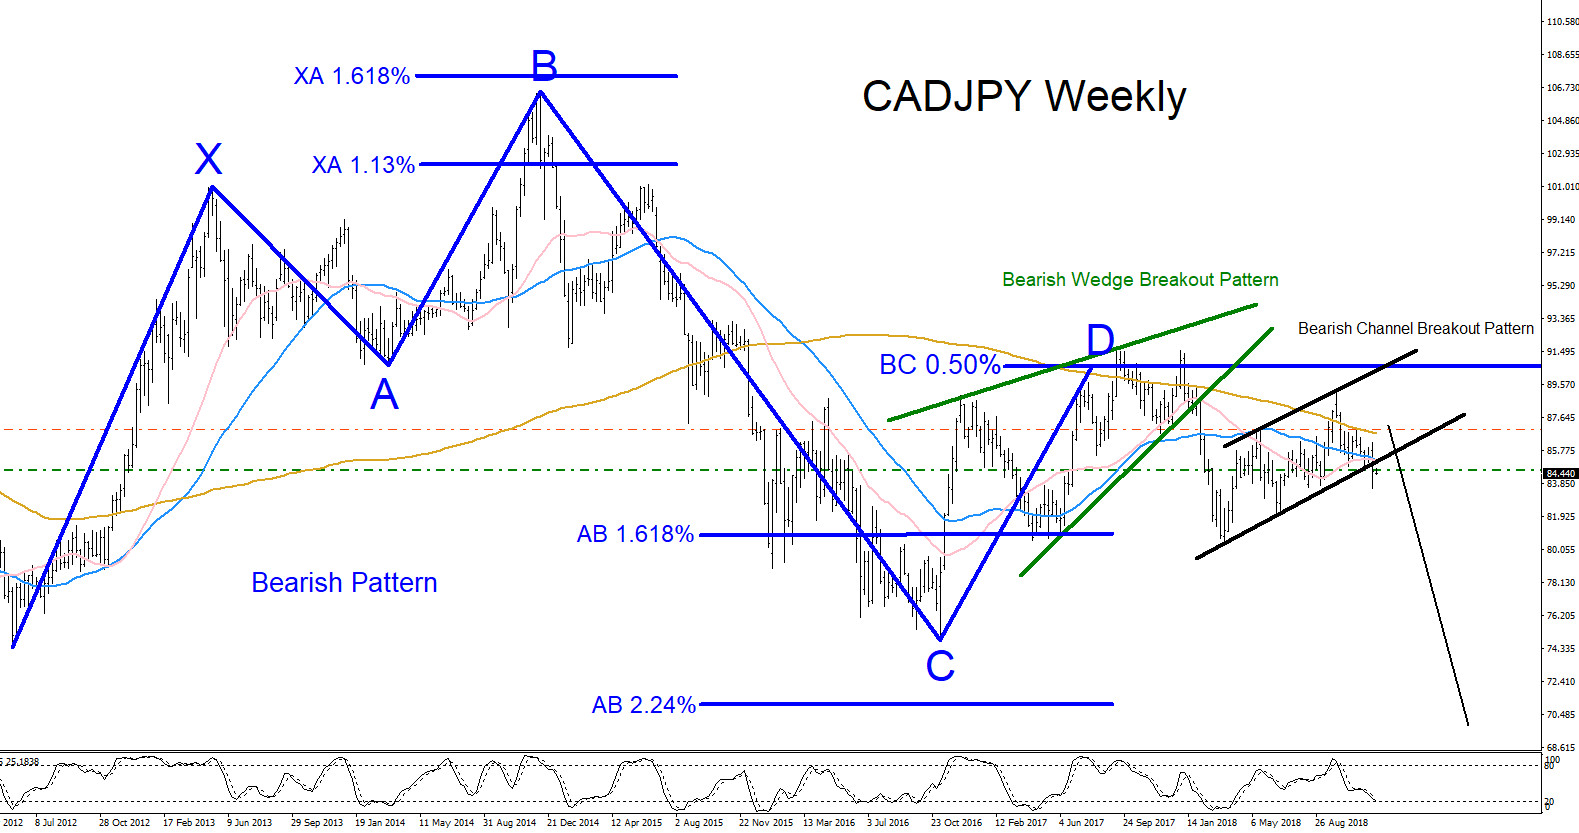
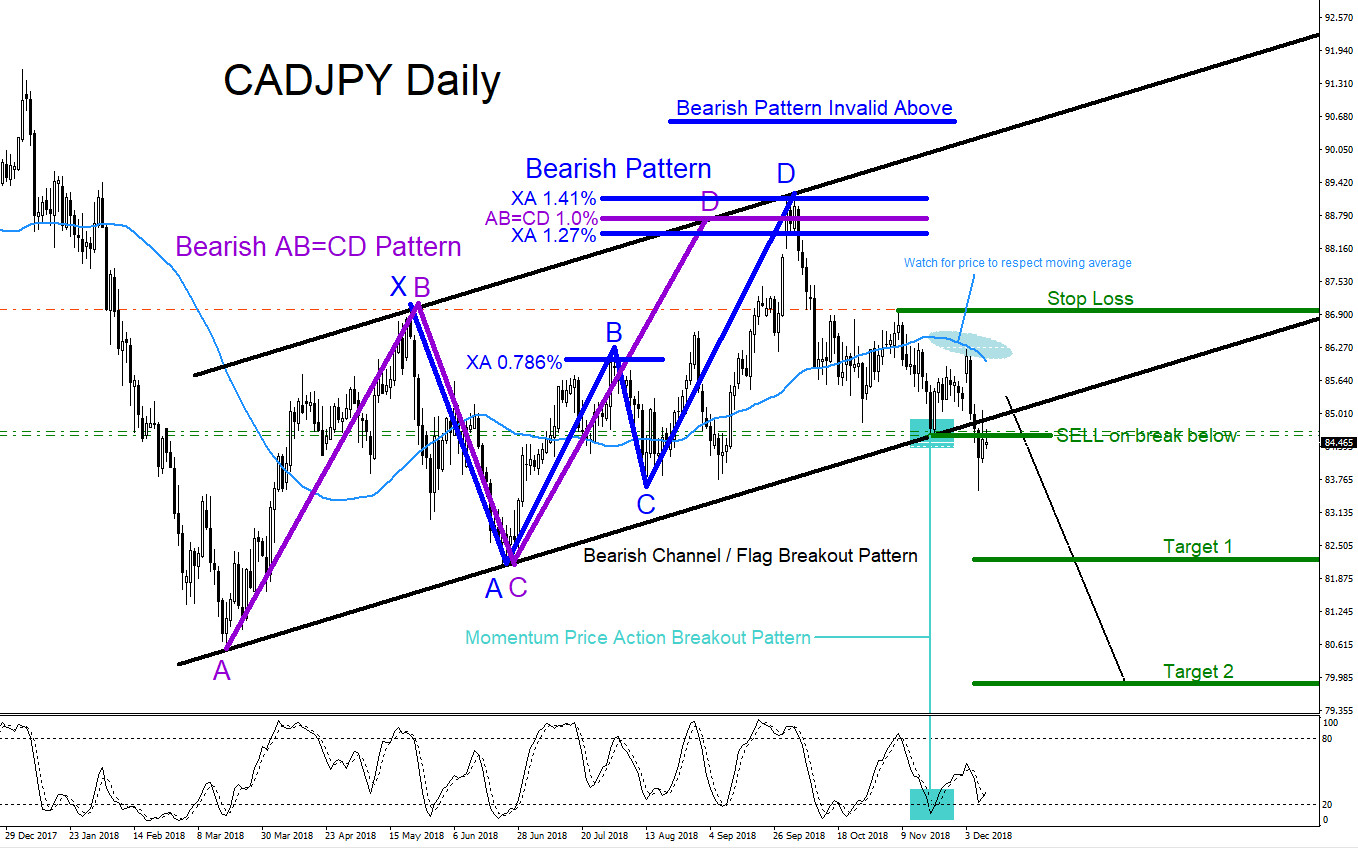
CADJPY looks poised to make another move lower. There are bearish market patterns that are clearly visible. On the Weekly chart below, CADJPY formed a Bearish Pattern (blue) that triggered sellers on September 10/2017 high where price reached the BC 0.50% Fib. retracement level. From this level CADJPY reversed lower signalling that the September 10/2017 high is a significant level of resistance. CADJPY made a move lower that bottomed out on March 18/2018, the pair bounced higher and is taking form of a correction higher but has reversed lower from the September 30/2018 highs where it was met with bearish patterns that formed on the Daily chart (purple and blue). The September 10/2018 high is a now considered to be the new significant level of resistance. If price can make a good break below the Bearish Channel/Flag (black) bottom trend line we can expect a continuation move lower. Also on the Daily chart below, the pair can be seen respecting the 50MA (light blue) which also signals that sellers/bears are still control. As for now we will continue to expect more CADJPY downside so traders should watch for possible selling opportunities looking to hit the targets that are set on the Daily chart below.
CADJPY Weekly Chart 12.10.2018
CADJPY Daily Chart 12.10.2018
Of course, like any strategy/technique, there will be times when the strategy/technique fails so proper money/risk management should always be used on every trade. Hope you enjoyed this article and follow me on Twitter for updates and questions> @AidanFX or chat me on Skype > EWF Aidan Chan
*** Always use proper risk/money management according to your account size ***