
The SPX Index is trading within a Blue Box in our system, these boxes are areas in which the Market needs to define whether it will become an Impulsive sequence which runs in 5-9-13 waves or corrective sequence in which runs in 3-7-11 waves. Many traders who follow The Elliott wave Theory understand the idea of 5 waves followed by 3 waves back as shown in the following chart.

An impulse is 3 advances of 5 waves and 2 pullbacks in 3 waves which make a total of 5 swings. On the other hand, an ABC structure only shows 2 advances of 5 waves and one pullback in 3 waves. It is shown in the following chart.

The difference between an Impulse and ABC is the extension within wave (III) which the SPX Index is not showing at this moment. We are an Elliott Wave Forecasting company but we have developed many other techniques that we use in our analysis and one of them is called the Blue Box system which is based on high-frequency trading. Market is not the same as it was back in 1930’s and hence Elliott Wave needs adjustment in current times. Consequently, we developed a system with rules which we added to the Elliott Wave’s basic rules which are available at our website. For us, it is really simple, as far as price is above the 100% extension of the first leg i.e. (a) / ( ( I ) related to ( b ) / (II ) but below the 1.618 extension of the same two points, the Market is within a twilight area. In this area, either side could end up being a winner. The following chart shows the Grand Supercycle of the S&P 500 Index which is showing a possible ABC structure and the Grand Supercycle Blue Box area.
SPX Quarterly Elliott Wave Analysis 11/27/18
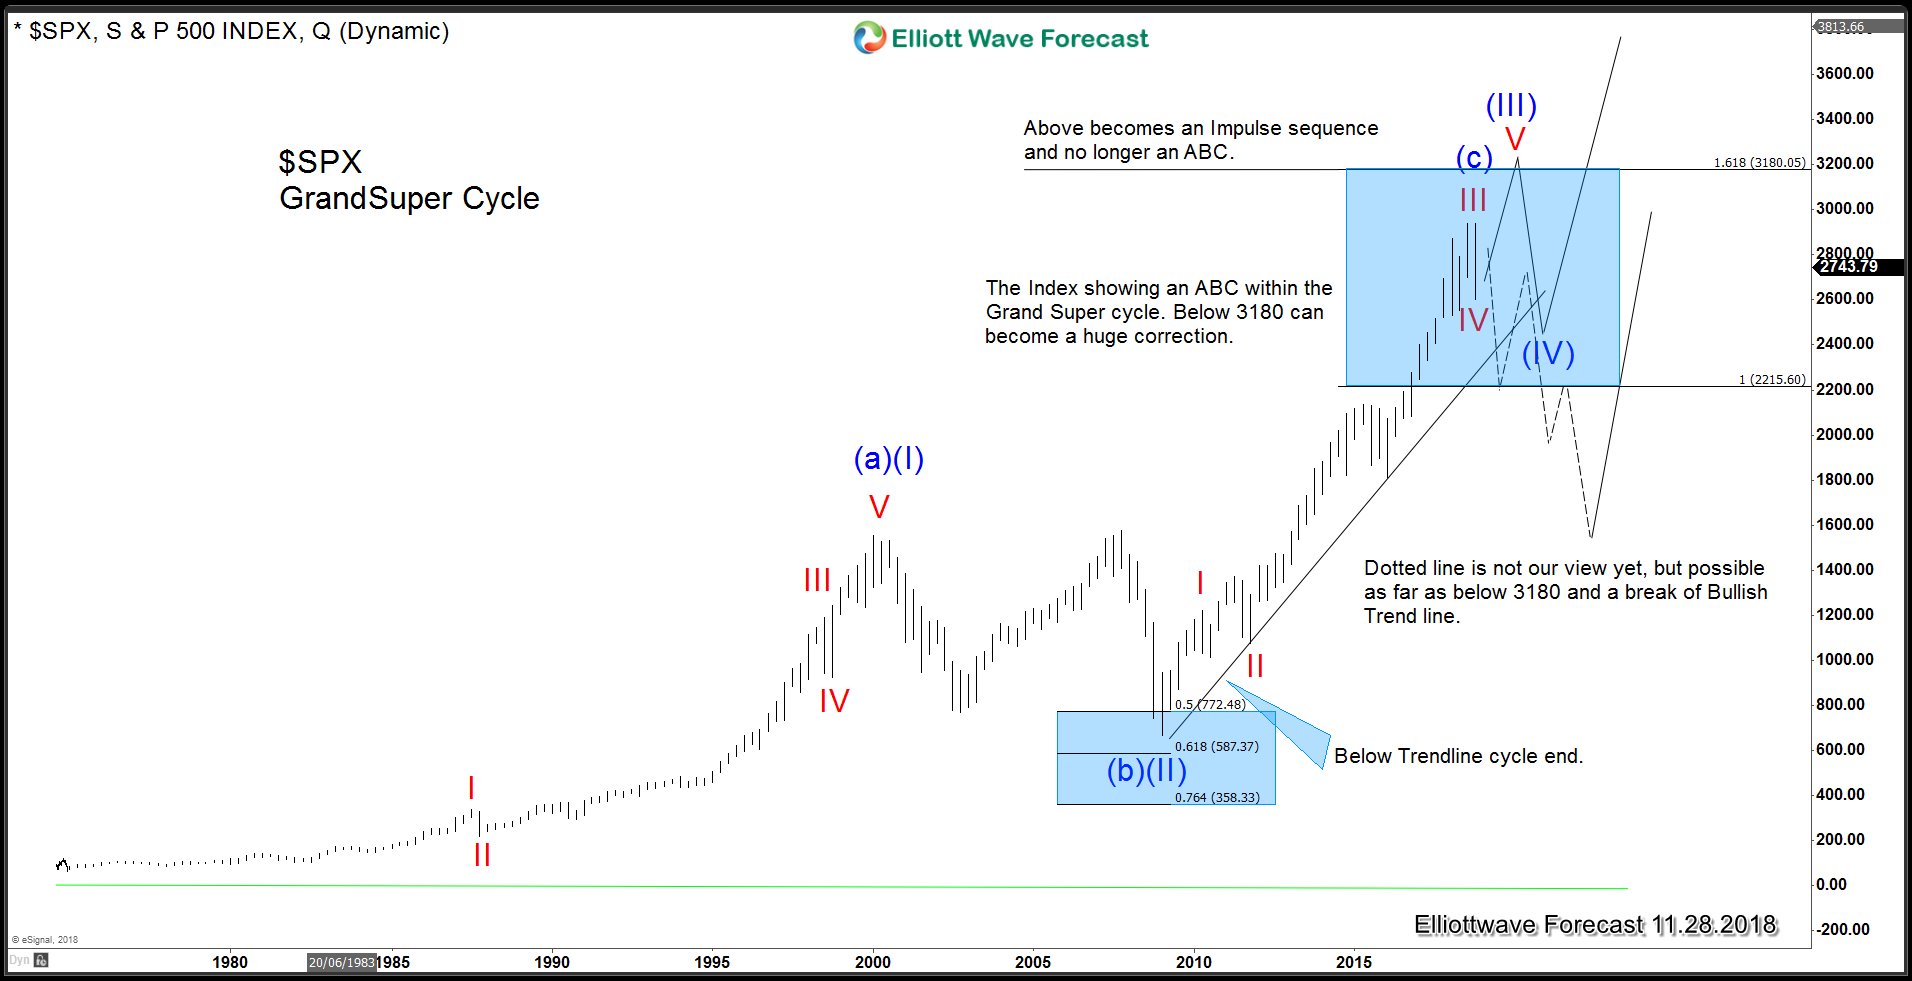
We do understand that the market makers need to decide in which direction we are heading. Whether we are going to trade above the 3180 area or correct the Grand Super cycle which should be a similar correction to the one from 2000-2009. In that case, a huge peak has been reached. At this moment the Index is trading below the 1.618 Fibonacci extension which is at 3180 but still holding above the trend line from 2009 lows which means we can still be within the powerful wave (III) and finally break the Blue Box to the upside, as shown in the following chart and that is our current view as well.
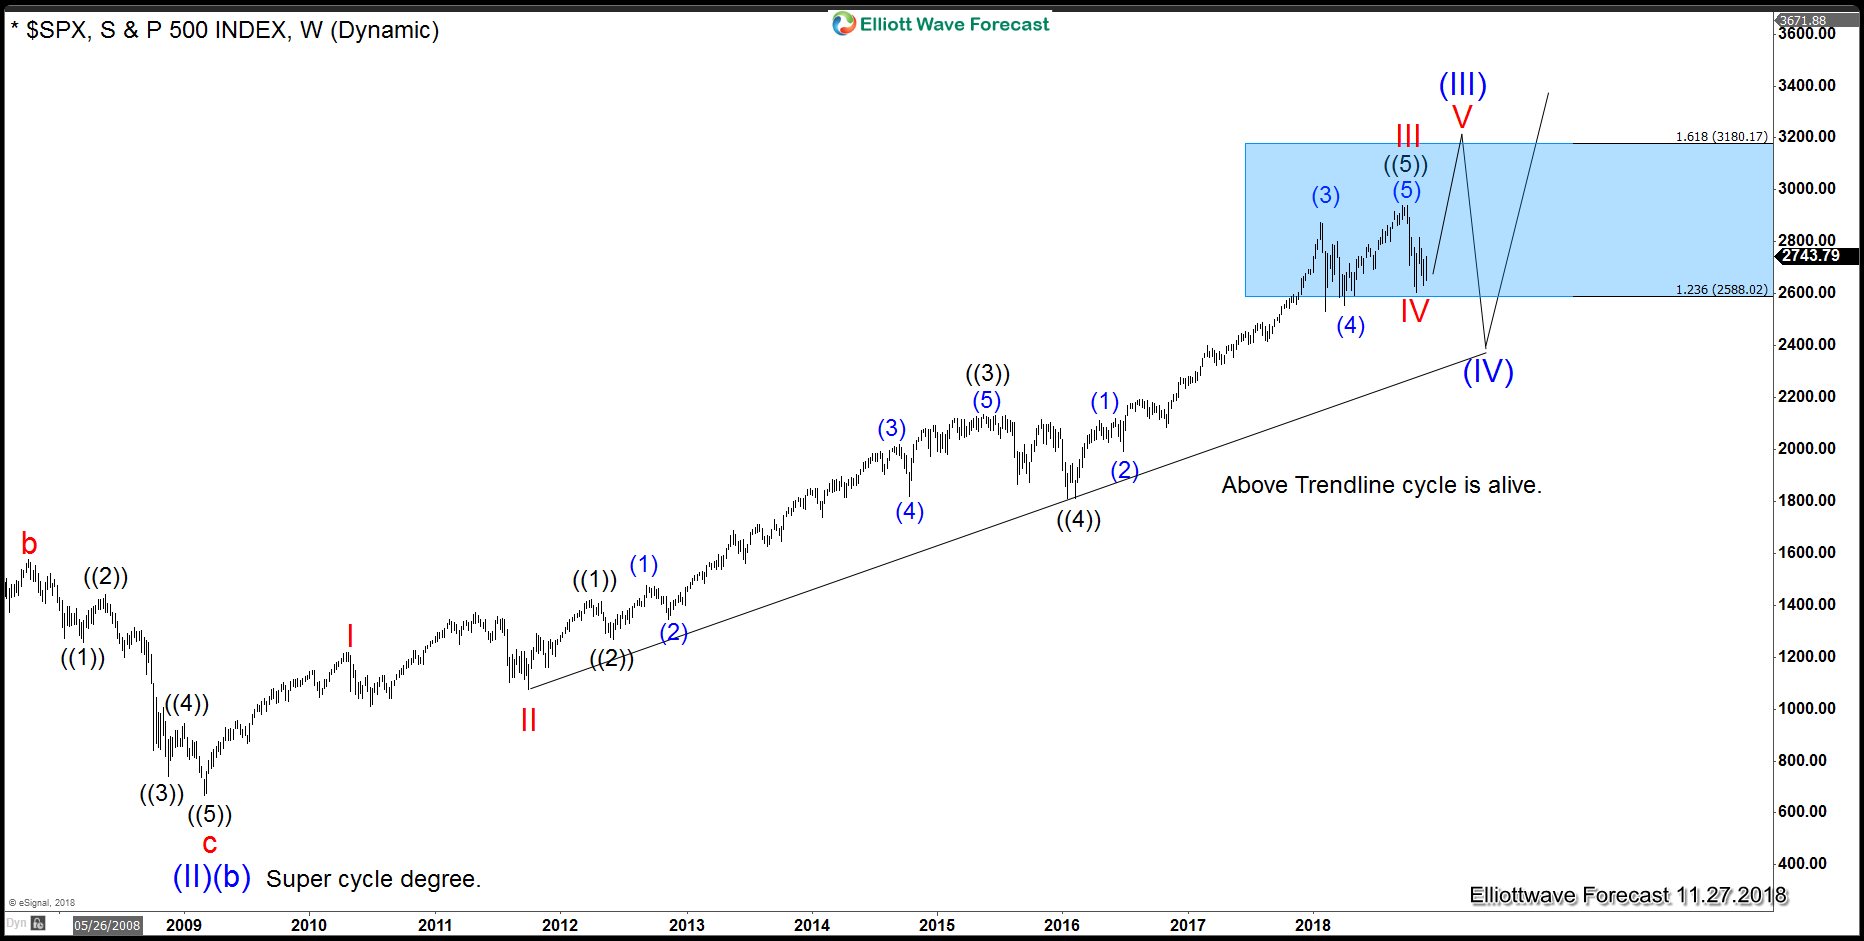
As we always do, we do not forecast tops or bottom at Elliottwave-Forecast but we always understand the areas in which we are trading. We have been recommending trading the long side since 2010 and we still recommend the long. But with caution and always in the sequence of 3-7-11 swings which is the corrective sequence of the Market. All we got is an ABC from the all-time lows into the blue box within the Grand Supercycle and Bulls need to extend the Supercycle degree from 2009 to break the 3180. Then the Market will extend in a series of (IV) and (V). There is no question that we are in dangerous times but knowing the nature will help an investor to navigate in such choppy waters where either side can make the case for a victory. Let’s see who is stronger and will win. So far the bulls are still in control and nothing in price and distribution is calling that the Grand supercycle has ended. As far as it stays above the trendline, it is a 4-hour correction and should be bought in 7 or 11 swings. The Index already did 3 waves from the peak and could continue to new highs from here, if it does 7 swings lower, should be a gift to buy at the next Blue Box area.