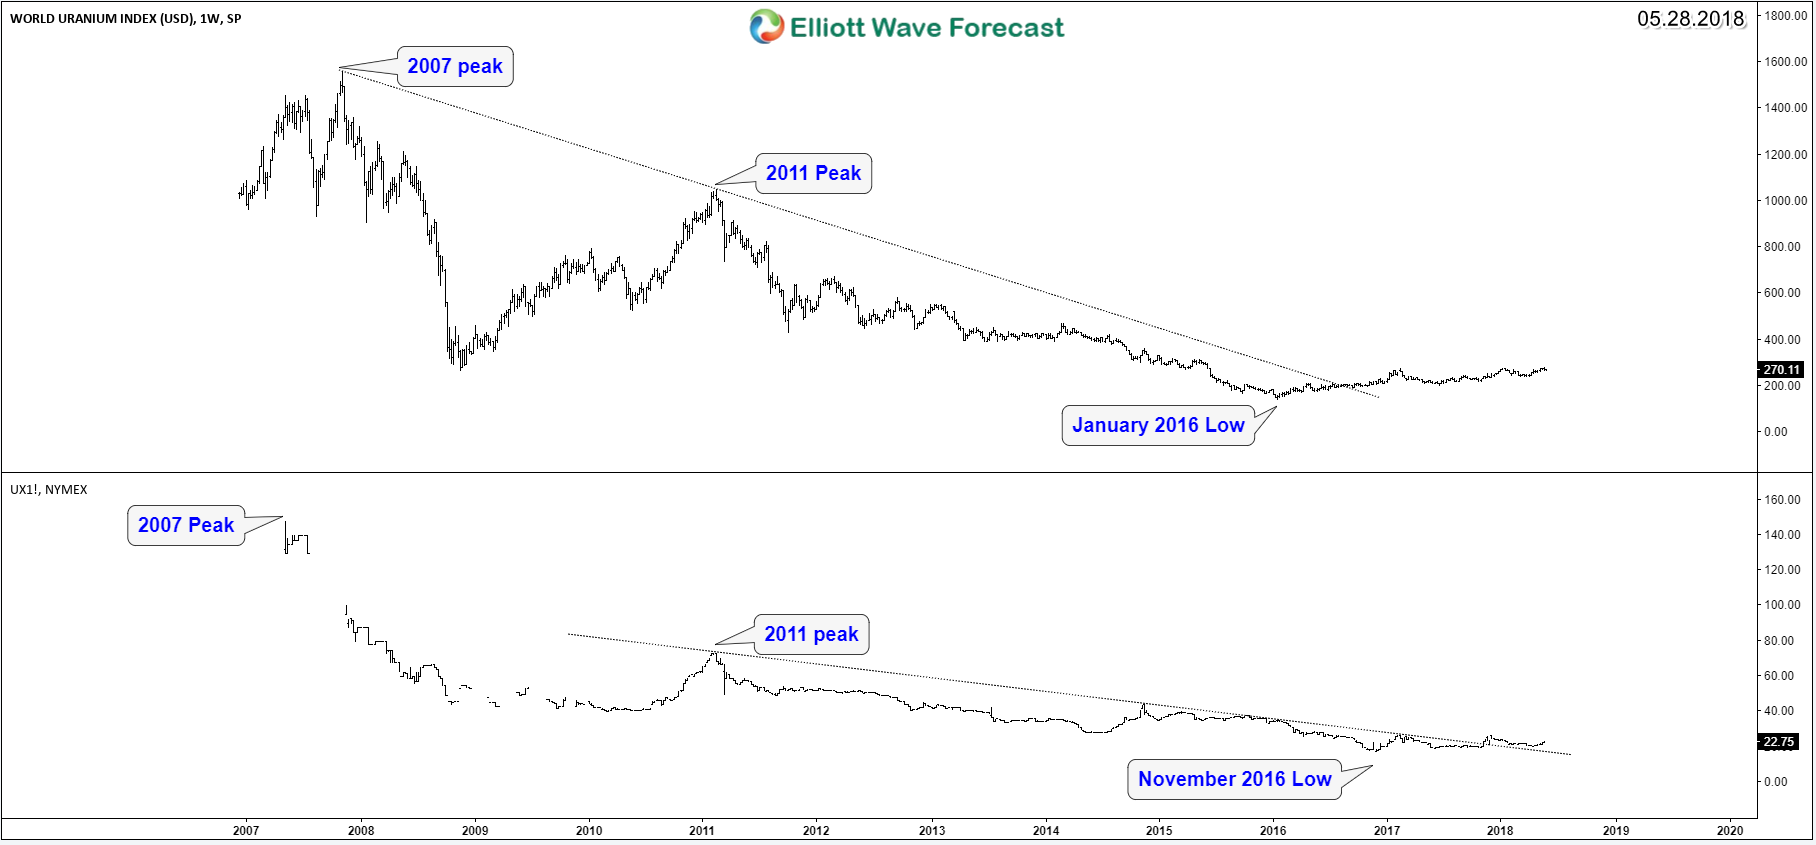
World Uranium Index (URAXPD) and Uranium Futures contract tracking the spot price of the metal which ended the downtrend cycle from 2007 peak and been bouncing higher since 2016 lows. The two instrument may have different dates for the peak or low but they share the same swings and URAXPD is the one leading move at current stage to the upside.
World Uranium Index vs UX1 (Uranium Futures)
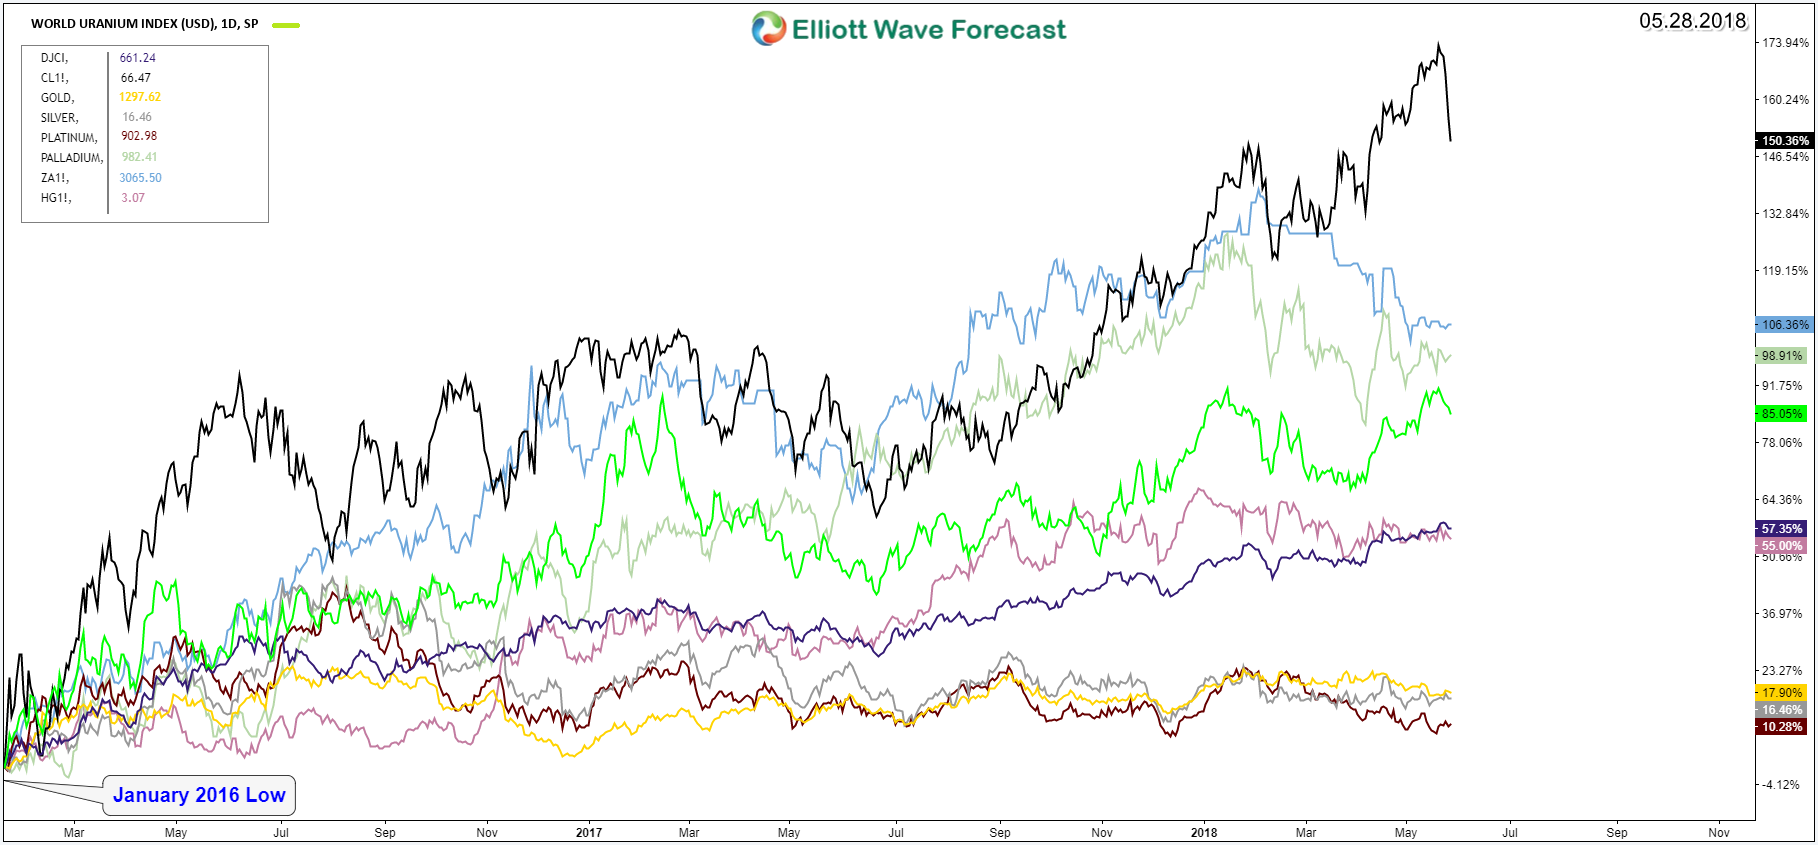
In the next chart, we overlay the majority of main commodities including Oil and precious metals which had the same low in 2016. We can notice that URAXPD is up 80% at current stage, it’s considered one of the outperforming instrument among the rest.
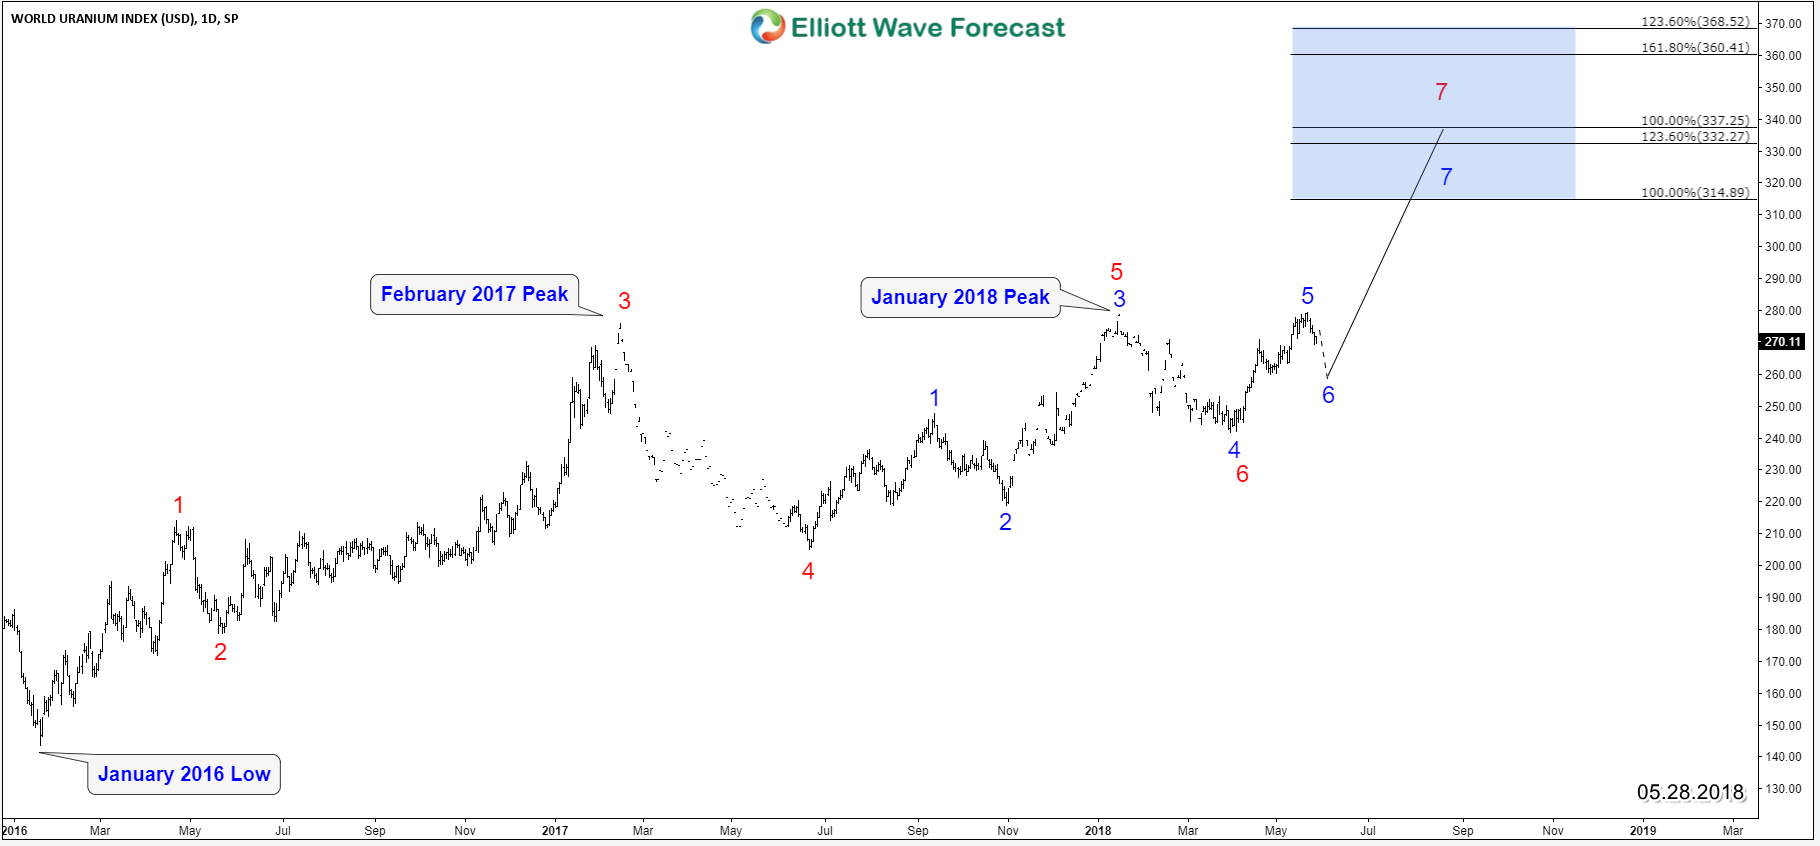
Looking at the daily chart of URAXPD from 2016 low, we can count 5 swings ( red count ) to the upside (which is different from the regular Elliott wave count) and we consider it as an incomplete sequence to the upside missing the final 7th swing higher toward equal legs area $337.2 – $368.5. We also can see another 5 swing ( blue count ) from 2017 low suggesting also more upside to take place toward a similar target area $314 – $332.
World Uranium Index URAXPD Elliott Wave Daily Chart
Consequently both sequence from 2016 & 2017 are bullish and suggesting that Uranium price will remain supported in the coming few months to see higher levels. Uranium does not trade on an open market like other commodities. But you can get exposure by trading a related Etf like URA or a related stock like CCJ.


