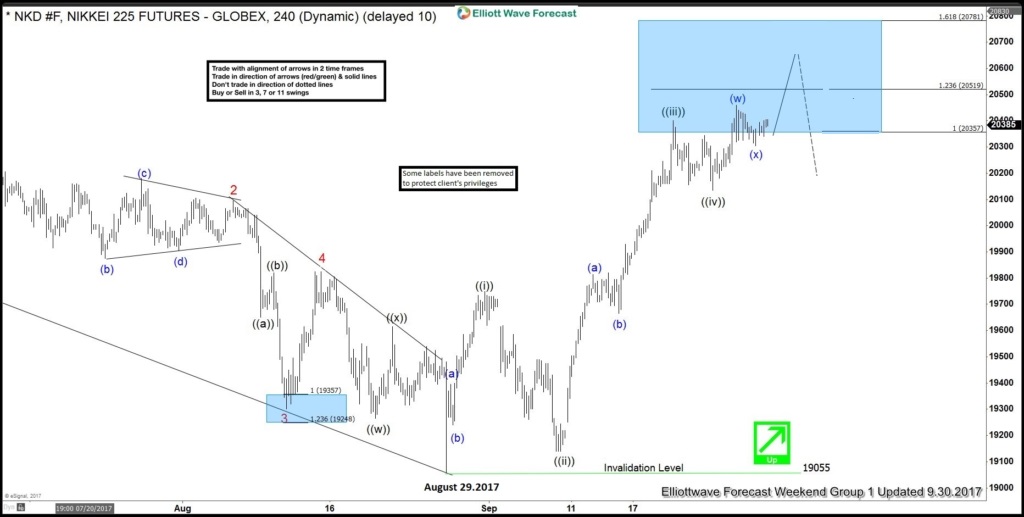
Short term Elliott wave view in Nikkei suggest that the cycle from August 29.2017 low (19055) is unfolding in 5 waves pattern. However looking at the internal subdivision of each wave the bounce looks corrective in nature with upside extensions. Thus suggesting that the Nikkei cycle from August 29 low (19055) could be following a leading Diagonal pattern in Minor wave A higher.
Where Minute wave ((i)) ended at 19740 peak as a flat structure, Minute wave ((ii)) ended at 19229. Minute wave ((iii)) ended at 20496 peak in 3 swings as zigzag structure. Where Minutte wave (a) ended at 19898 and Minutte wave (b) at 19765 low. Minute wave (((iv)) ended at 20131 low. From there Minute wave ((v)) remains in progress in 3 swings, where Minutte wave (w) ended at 20460, Minutte wave (x) at 20305 low. While above 20131 low, Index is expected to see further strength towards 20630 – 20707 to complete wave ((v)) of the Diagonal structure and then it should pull back in 3 waves at least. RSI divergence with respect to wave ((iii)) should remain intact with the next push higher for the diagonal ideal to remain valid. If RSI divergence is erased, then structure would become a triple three Elliott wave structure.
Nikkei 4 Hour Elliott Wave Chart
Source : https://elliottwave-forecast.com/stock-market/nikkei-nkd_f-elliott-wave-view-diagonal-structure/


