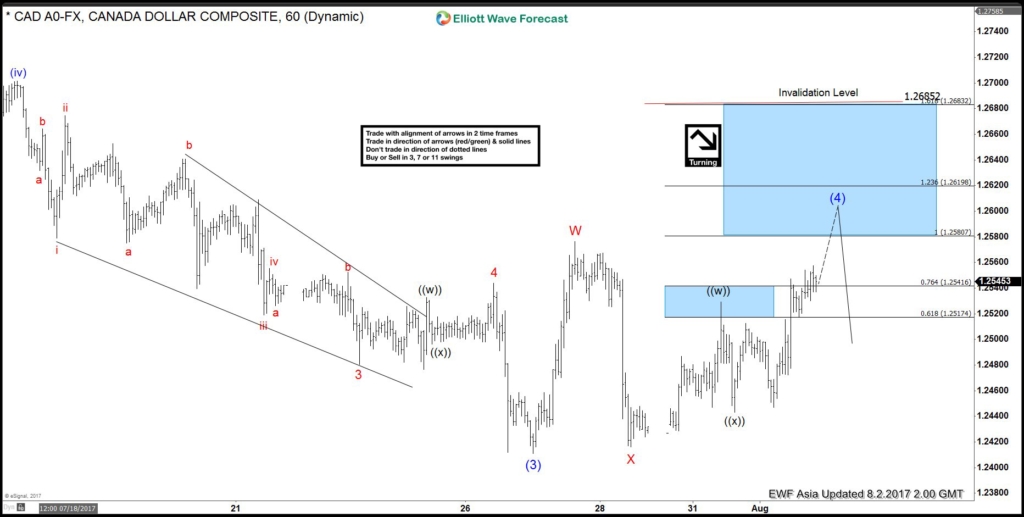
Short term USDCAD Elliott Wave view suggests the decline to 1.2411 ended Intermediate wave (3) of an Elliott Wave impulse structure from 6/2 peak. Intermediate wave (4) bounce is in progress as a double three Elliott wave structure where Minor wave W ended at 1.2576 and Minor wave X ended at 1.2416. Minor wave Y is subdivided also as a double three Elliott Wave structure. Up from 1.2416 low, Minute wave ((w)) ended at 1.253 and Minute wave ((x)) ended at 1.2443. Near term focus is on 1.258 – 1.262 area to complete Intermediate wave (4). Afterwards, pair should either resume to new low or at least pullback in 3 waves. We don’t like buying the proposed bounce.
USDCAD 1 Hour Elliott Wave Chart
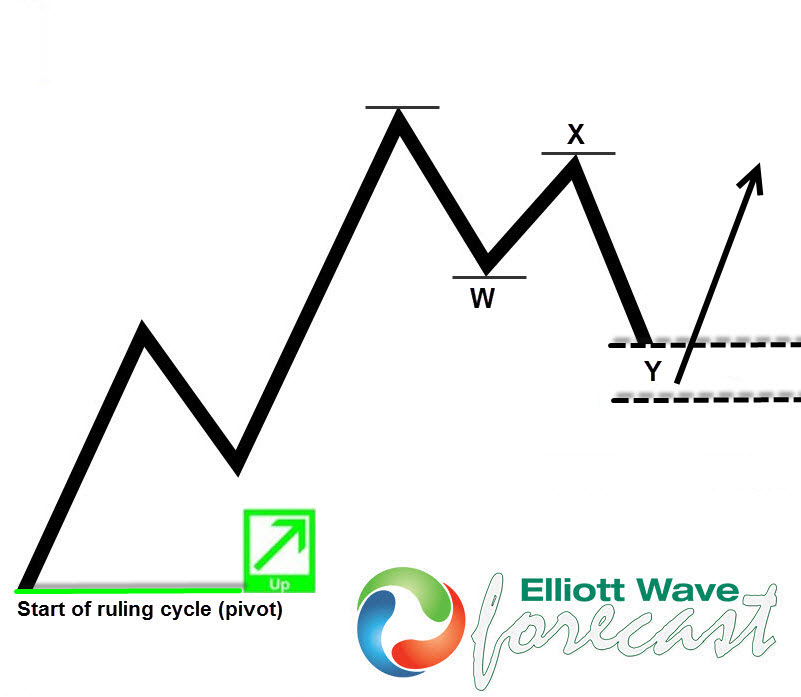
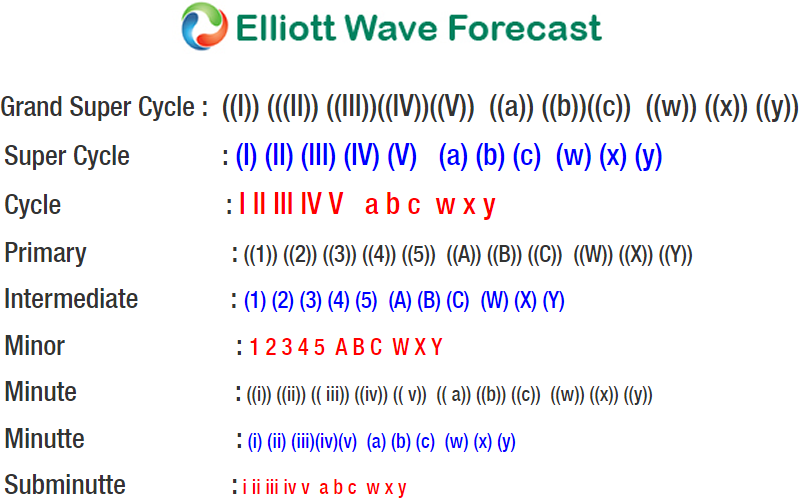
Elliott Wave Theory is one of the most powerful forms of Technical Analysis to forecast the cycles and trends of financial markets. The Theory works by identifying the extremes in investor psychology. Elliott Wave Theory is flexible enough to incorporate any possible pricing structure. There is always an Elliott wave pattern suitable for the wave structures. Today, the market moves mostly in corrective manners so the first step would be to learn to recognize 3 wave structures in the charts. The 3 waves could be labeled as ABC but also as WXY as shown in the graph below. The way to label the 3 waves depends on the internal price structure of the wave subdivisions.
Source : https://elliottwave-forecast.com/forex/usdcad-elliott-wave-bounce-in-progress/


