After touching the descending trend line on daily chart from 1375.11 (2016 high) to 1337.28, XAUUSD started a bearish movement from 1295.44. Now the fall extended to as low as 1214.19, facing the support of the rising trend line from 1180.51 to 1194.94.
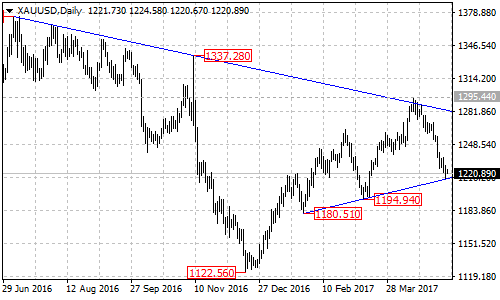
Will the bearish movement continue?
Let’s look into the 4-hour chart. The XAUUSD pair stays in a descending price channel which is acting as resistance at the top line of the channel.
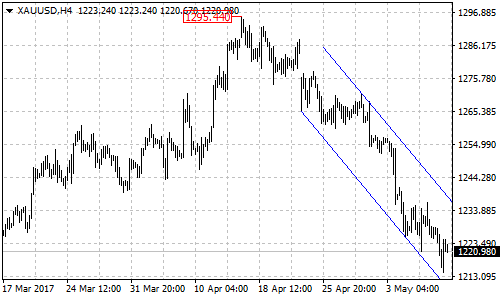
On the downside, as long as the pair stays in the channel, the short term downtrend from 1295.44 could be expected to continue, and further decline to test 1194.94 key support is possible.
On the upside, a clear break out of the top line of the channel (now at 1239) will indicate that the short term downtrend is complete. This could trigger a correction for the downtrend and the target would be at 1253 – 1263 area.
Attention should be paid to 1194.94 key support. A breakdown below this level will confirm that the whole uptrend from 1122.56 had completed at 1295.44 already.
What would be the next target if 1194.94 support gives way?
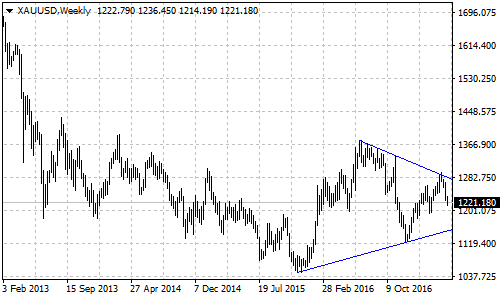
XAUUSD is forming a triangle pattern on weekly chart. A breakdown below 1194.94 key support could trigger a bearish movement toward the lower line of the pattern, now at 1150 area.
Technical Levels
support levels:
- The ascending trend line from 1180.51 to 1194.94, now at 1215.
- The key support 1194.94.
- The lower line of the triangle pattern on weekly chart, now at 1150 area.
Resistance levels: The top line of the descending price Chanel on 4-hour chart, now at 1239, followed by 1253 and 1263.