
In this Elliott Wave update, we take a look at the latest structure in Apple Inc. ($AAPL). The stock completed a bullish cycle from the April 2025 low and has now turned lower in what appears to be a larger corrective sequence. As a result, the current decline is unfolding as a 7 swing correction, with the next important reaction area coming at the blue box reversal zone.
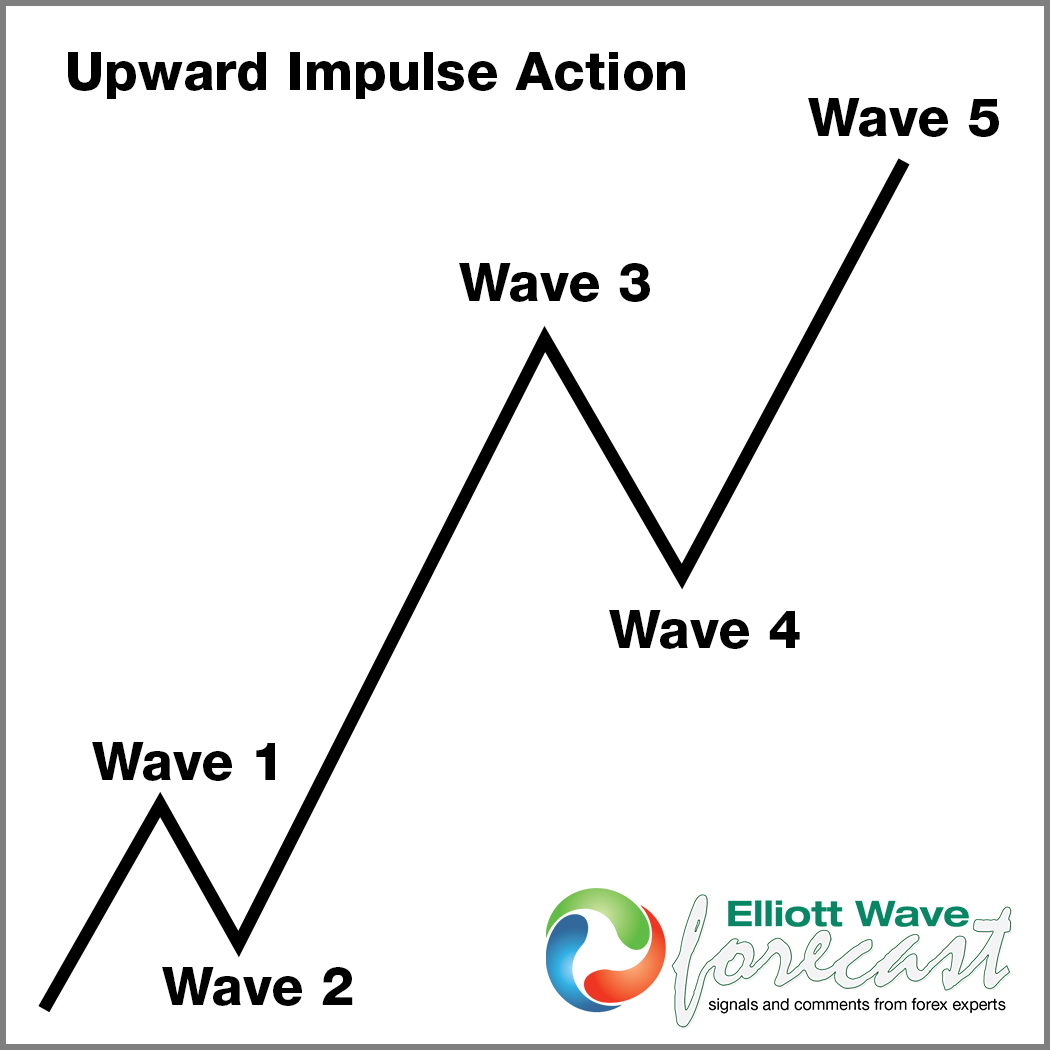
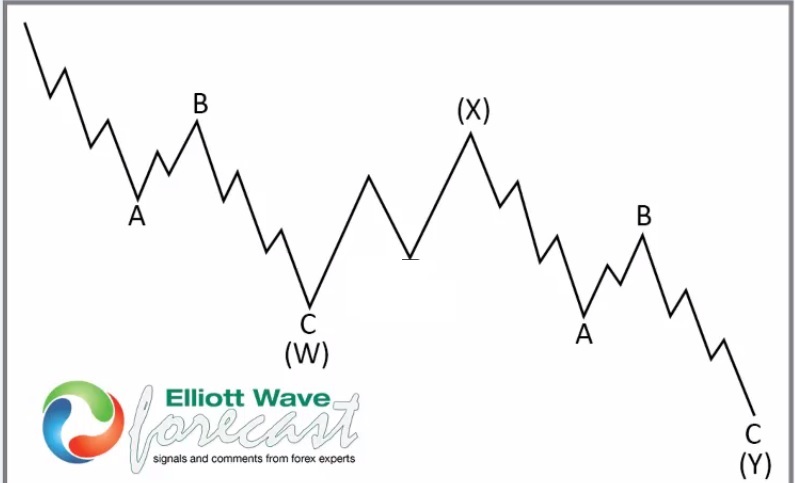
5 Wave Impulse + 7 Swing WXY correction
$AAPL Daily Elliott Wave View March 8th 2026

Looking at the daily chart, $AAPL ended the advance from the April 2025 low in a completed impulsive sequence. After that, the stock failed to extend higher and instead started to correct the entire cycle. Consequently, price action shifted from a bullish trending structure into a complex corrective pattern.
At this stage, we do not view the decline as a simple three-wave pullback. Instead, the structure points to a 7 swing correction, which Elliott Wave traders often label as W-X-Y. In other words, the market is still working through a broader corrective phase rather than preparing for an immediate resumption of the larger upside trend.
7 Swing Correction Taking Place
The correction from the peak is unfolding in a sequence that remains incomplete. Therefore, while short-term bounces can appear along the way, the broader structure still points to additional downside before the correction ends.
This is important because many traders often mistake the first bounce during a correction as the start of a new bullish leg. However, in a 7 swing structure, temporary rebounds are common and usually act as part of the overall correction. For that reason, the current view continues to favor more downside pressure after the next reaction higher.
Blue Box Reversal Zone Is the Key Area
Most importantly, traders should watch the blue box, which comes between 235.80 and 207.87. This area marks the next high-frequency reversal zone, where the current leg lower should find support.
Typically, when price reaches the blue box, sellers begin to take profit while buyers look for a reaction higher. As a result, a $AAPL should produce a relief bounce from this area. However, that bounce should stay corrective and should not begin a new impulsive rally.
In fact, the preferred scenario remains that $AAPL bounces from the blue box and then turns lower again to continue or complete the broader correction.
Short-Term View
As long as $AAPL remains within this corrective structure, traders should be careful not to chase upside strength too early. Although the stock can produce a notable rebound from the blue box area, the larger pattern still suggests that rallies should remain capped before another leg lower unfolds.
Meanwhile, the chart also shows that the broader bullish risk remains valid above the long-term invalidation level. Even so, in the near term, the path still favors corrective price action rather than immediate trend continuation to the upside.
Trading Strategy
From a trading perspective, the main focus is on how price reacts once $AAPL reaches the blue box area. If buyers respond there as expected, the stock can deliver a tradable recovery. However, traders should keep in mind that this bounce is expected to be a relief rally, not necessarily a completed low.
Therefore, the preferred strategy is to respect the reaction from the blue box but also remain aware that the market can turn lower again afterward as part of the 7 swing correction.
Technical Summary
To summarize, $AAPL has likely completed its cycle from the April 2025 low, and a 7 swing correction is now taking place. Furthermore, the blue box area at 235.80–207.87 is the next important reversal zone, where a relief bounce is expected before lower again.
Accordingly, traders should continue to monitor the current decline closely. While a bounce looks likely from the blue box, the overall structure still favors another move lower before the correction is fully complete.