
Bitcoin’s recent surge toward $91K has traders buzzing with excitment and some are already anticipating the start of next bullish leg, but the charts tell a different story. ProShares Bitcoin ETF (BITO) is flashing signs of weakness, with a potential retracement toward the $10.10 zone. In Elliott Wave terms, this suggests BTCUSD may still be consolidating in a corrective phase rather than gearing up for the next impulsive leg higher. Understanding these signals is critical for traders who want to avoid chasing momentum at the wrong time.
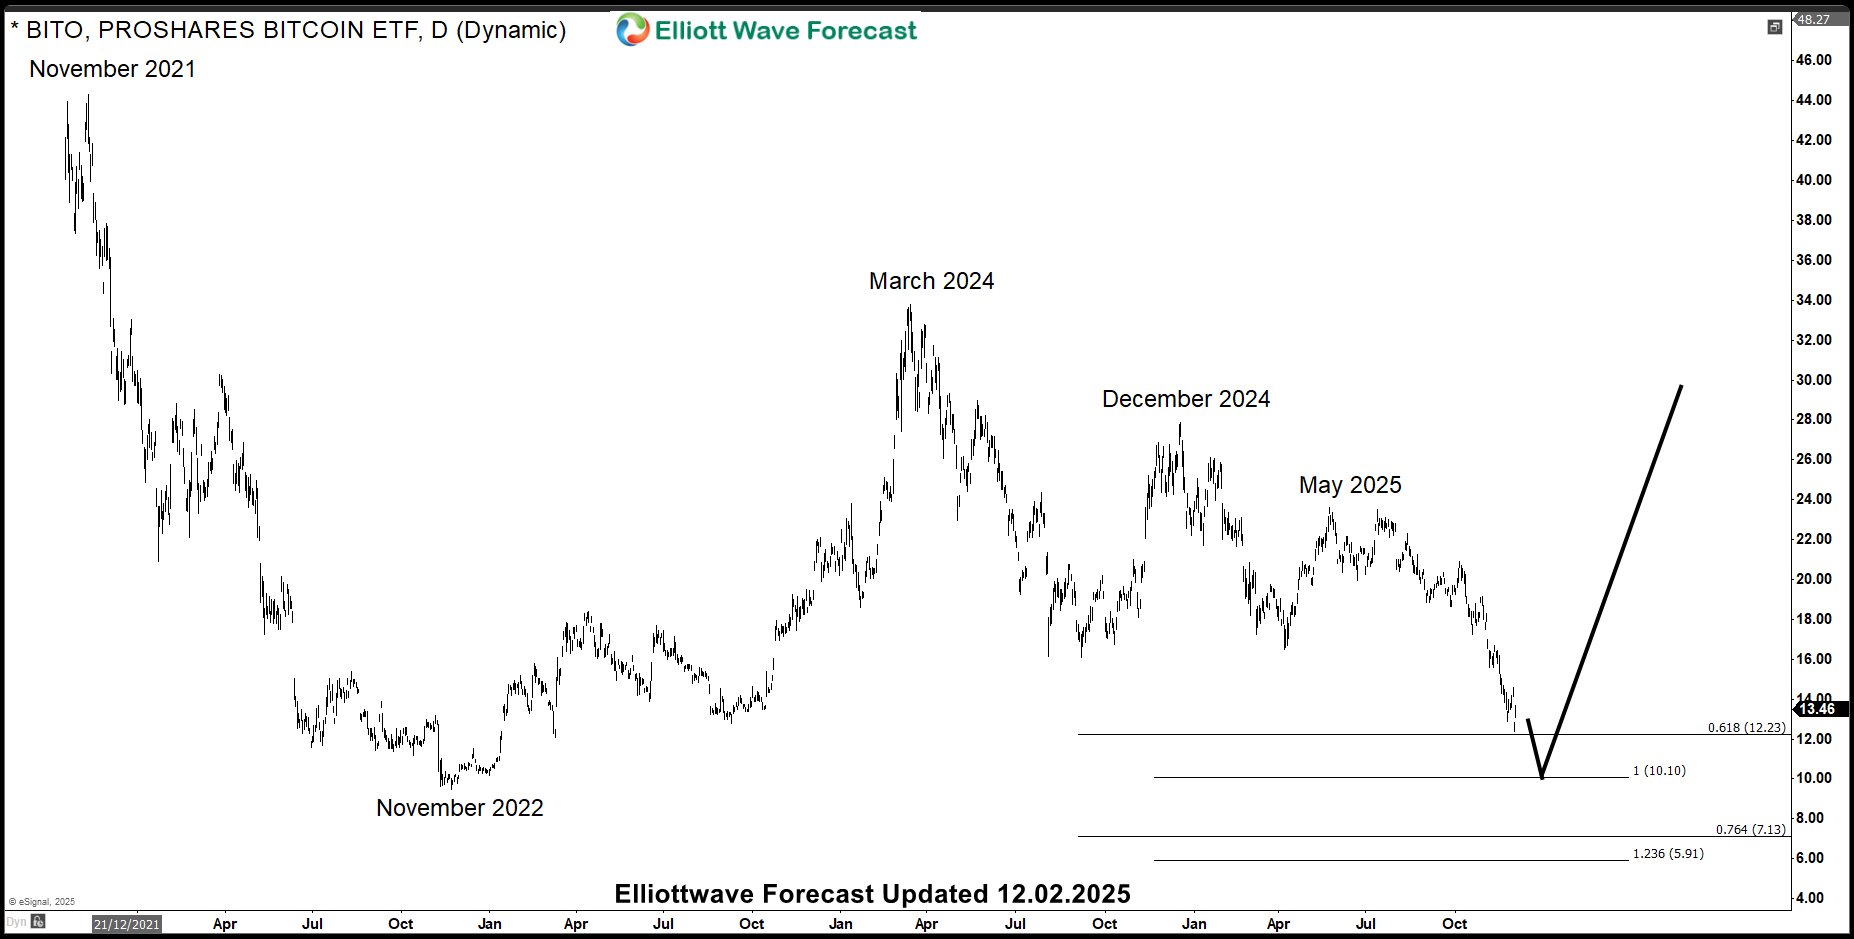
📉 BITO Bearish Sequence Points Toward $10.10
The ProShares Bitcoin ETF (BITO) completed its cycle from the November 2022 low back in March 2024. Since peaking in March 2024, the ETF has been trending lower, carving out what appears to be an incomplete bearish sequence against the December 2024 and May 2025 highs. This structure suggests that short-term bounces are likely to fail, reinforcing the case for further downside. The key level to watch is $10.10, which represents the 100% Fibonacci extension of the first leg down from the March 2024 peak, projected lower from the December 2024 peak. In Elliott Wave terms, this aligns with a corrective sequence that has yet to fully play out. Traders should be cautious about chasing rallies here, as the broader cycle bias favors continuation lower before any sustainable reversal can take shape.
BITO’s Chart Suggests Bitcoin Correction Not Over Yet
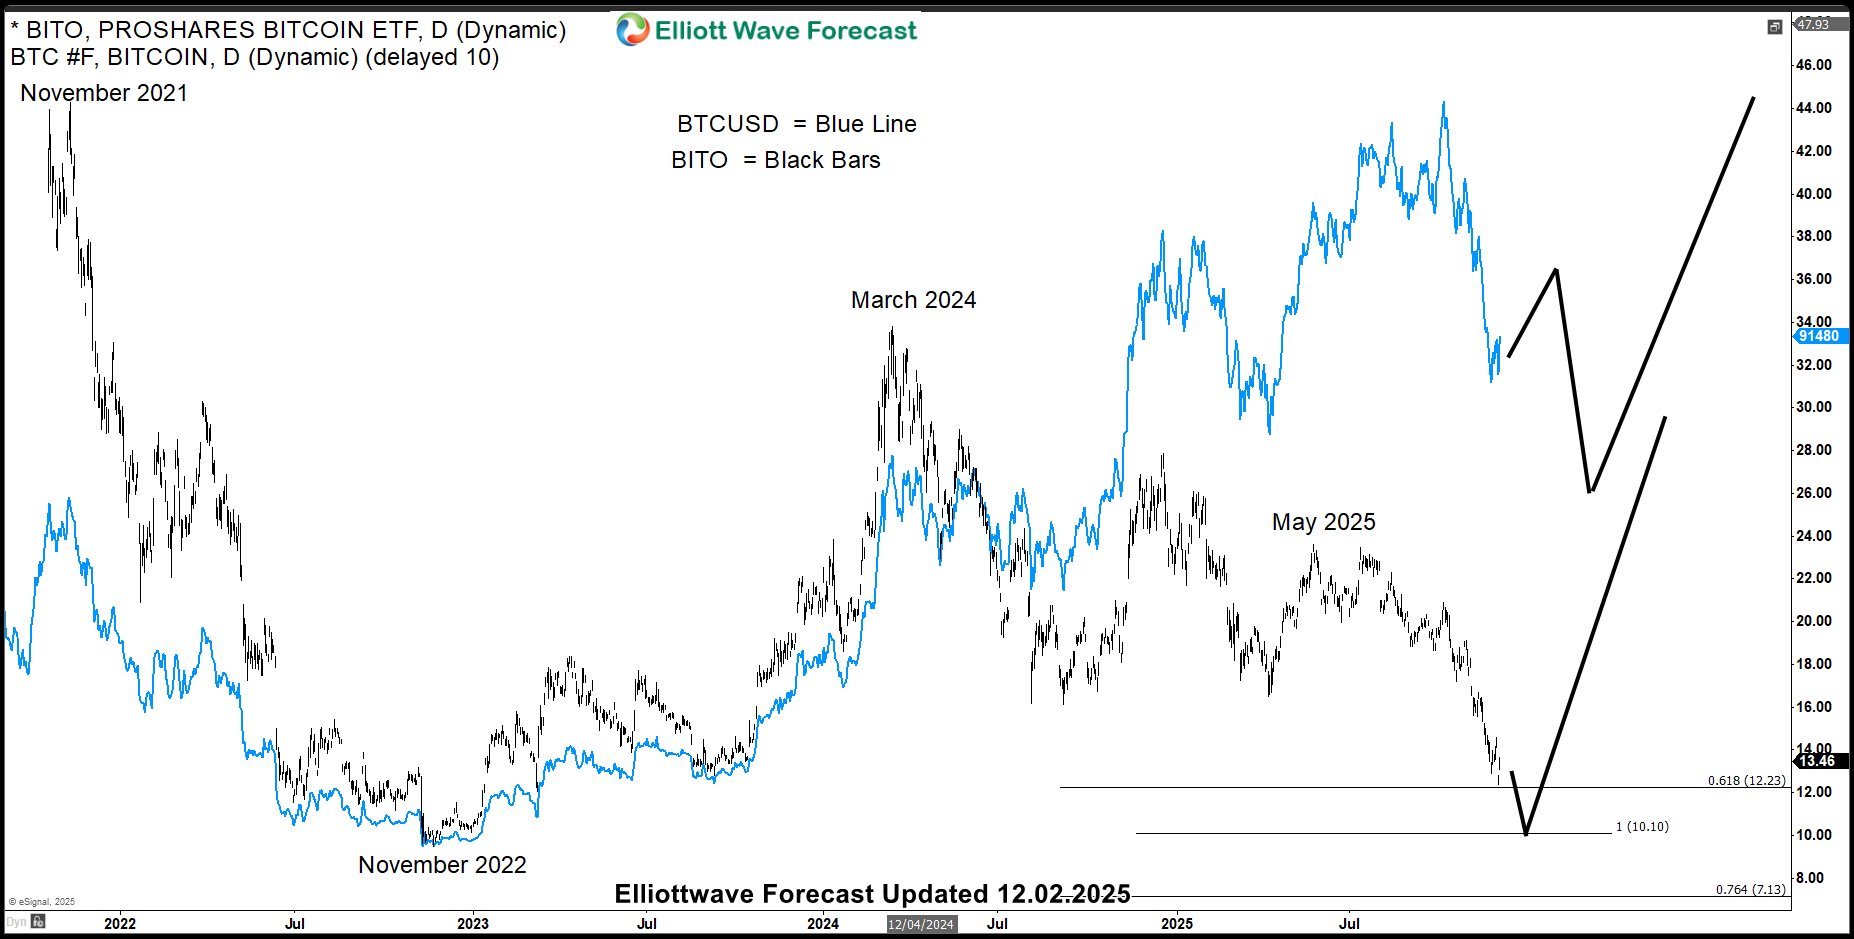
This chart highlights how closely Bitcoin ($BTCUSD) tracked BITO (ProShares Bitcoin ETF) from the November 2022 low to the March 2024 high. While the two assets appear to diverge after March 2024, a closer inspection reveals that Bitcoin continued to follow BITO’s directional path, albeit with a different magnitude of swings. This divergence in amplitude allowed Bitcoin to extend its rally all the way to the October 2025 high, even as BITO began its corrective phase. The recent decline in Bitcoin suggests that it has now completed its cycle from the November 2022 low, and is entering a broader corrective phase. Importantly, this correction is expected to persist until BITO reaches its extreme area near $10.10—a level derived from the 100% Fibonacci extension of the first leg down from the March 2024 peak, projected from the December 2024 peak.
Bitcoin Bulls, Hold Your Horses—BITO’s Chart Has Other Plans
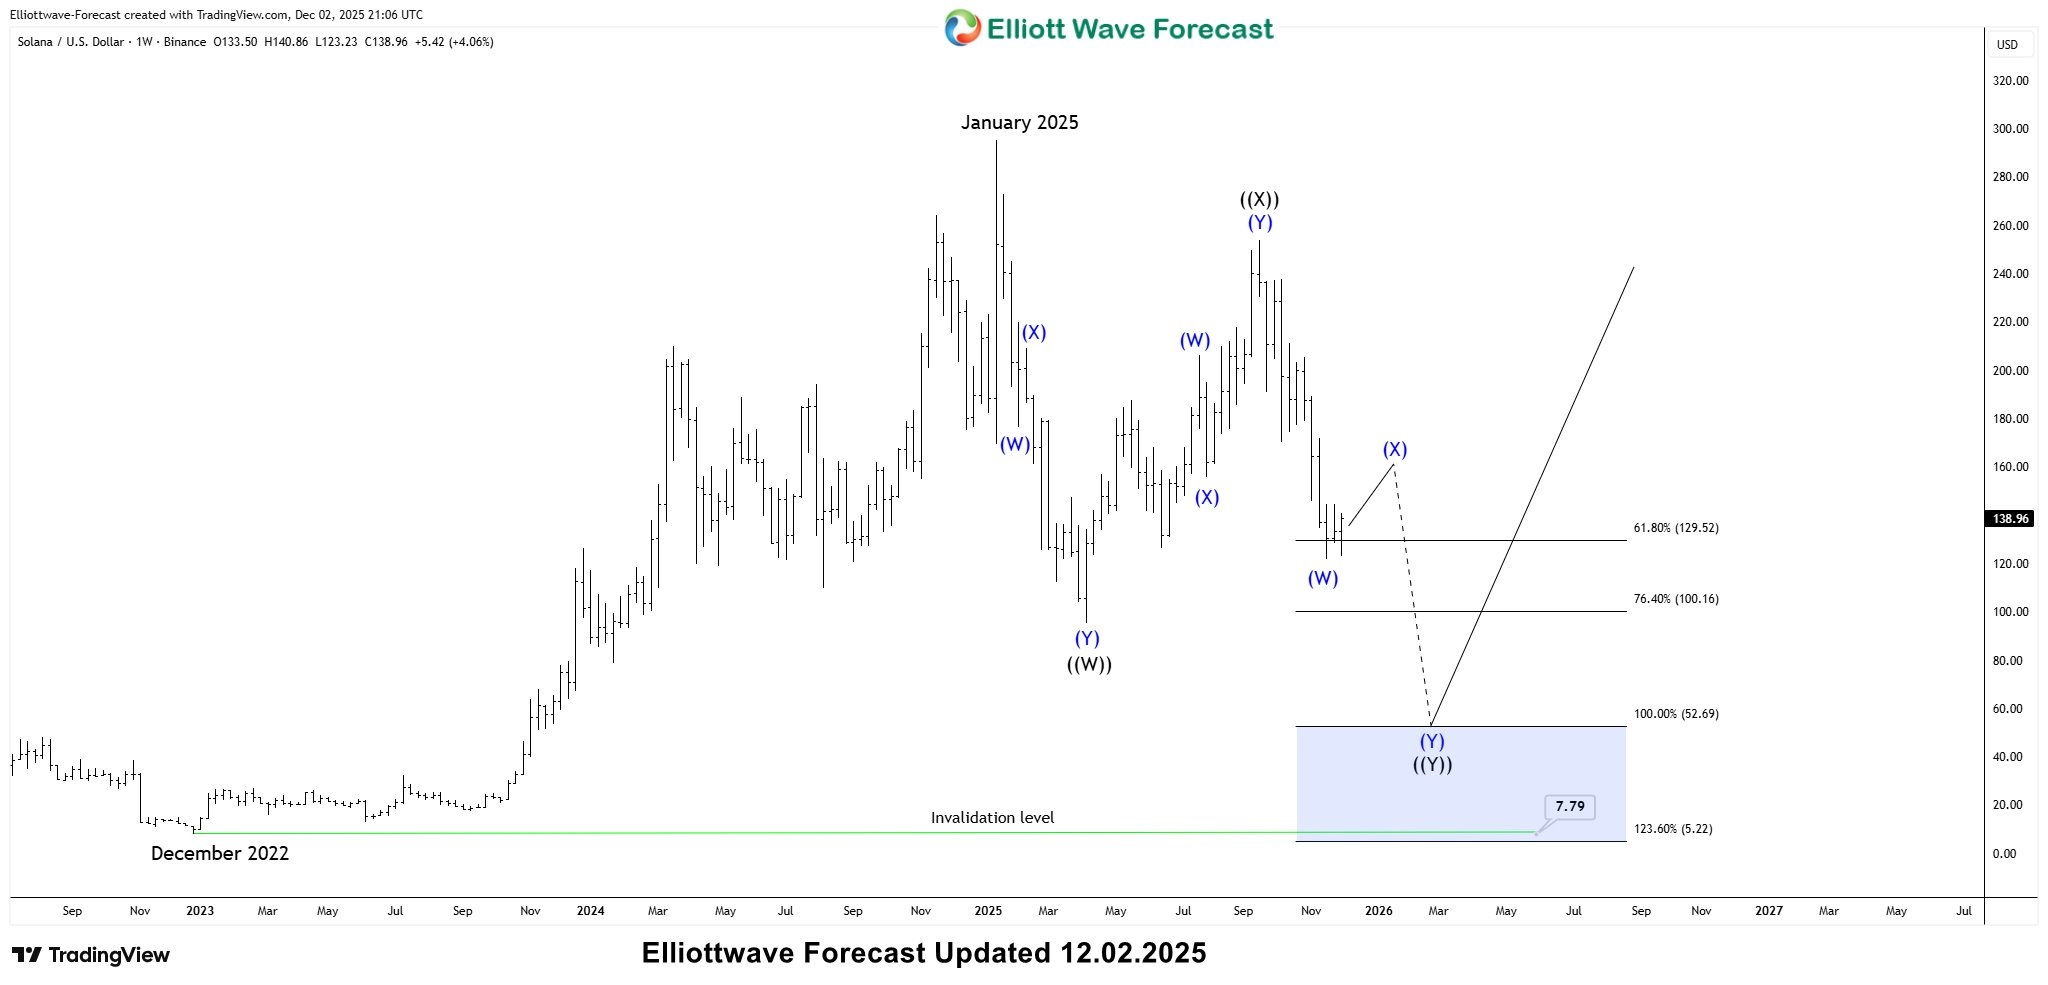
📉 Solana’s Correction in Focus
SOLANA’s weekly chart shows the cryptocurrency is still unwinding the cycle that began in December 2022. As far as price stays below September 2025 peak, all signs are pointing toward further weakness with rallies likely to remain short-lived. The next extreme area lies beween $52.69–$7.79 , where buyers are expected to step back in. This downside target should align with BITO reaching its $10.10 extreme area, suggesting that major crypto instruments could bottom together before starting a new bullish phase.
The charts and path is clear: BITO, Bitcoin, and Solana are all signaling that the crypto market is still in a corrective phase, with extreme areas yet to be tested. For traders, this is not the time to chase rallies but to prepare for the opportunities that will emerge once these levels are reached. Staying patient now can make all the difference when the next impulsive cycle begins.
Source: https://elliottwave-forecast.com/cryptos/bito-etf-warning-about-bitcoin-rally/