
Hello traders and welcome to a new blog post. In this one the spotlight will be on the EURNZD currency pair. This pair has been in a long-term bullish sequence since February 2017. Thus, it makes for an interesting instrument to add to the watch list. Is a setup imminent?
EURNZD continues to rise in a long-term bullish sequence from April 2015. Consequently, the long-term target lies between 2.1620 and 2.3900. However, the bullish cycle from February 2017 is corrective. It retraces the bearish impulse that unfolded between February 2009 and April 2015.
Eventually, when this long-term bullish phase ends, the pair should resume the broader bearish trend from February 2009. Still, traders should avoid trying to pick the top. Doing so is like catching a falling knife. Instead, it is safer to trade with the trend. Therefore, traders can keep buying alongside the ongoing corrective phase until the price reaches the 2.1620–2.3900 area, where bearish risk will likely grow stronger.
EURNZD Elliott Wave Analysis- Long term view
The first leg of the corrective cycle began in April 2015 and ended in March 2020, forming a double zigzag. Hence, it is labeled as wave (w) of the supercycle degree on the weekly chart shared with ElliottWave-Forecast.com members. Next, the connector wave (x) of the same degree fell from March 2020 to April 2022. From there, the third leg—wave (y)—started to advance. Interestingly, this wave (y) is unfolding as another double zigzag structure.
Wave w of (y) ended in August 2024, followed by wave x of (y) in September 2024. From that low, wave ((W)) of y of (y) finished at the April 2025 peak. Soon after, wave ((X)) ended the following month. Since then, a clean impulse has started for wave (A) of ((Y)) of y of (y). It extended to a new high within the larger cycle from February 2009. The H4 chart below highlights the sub-waves of wave (A).
EURNZD H4 Chart Analysis
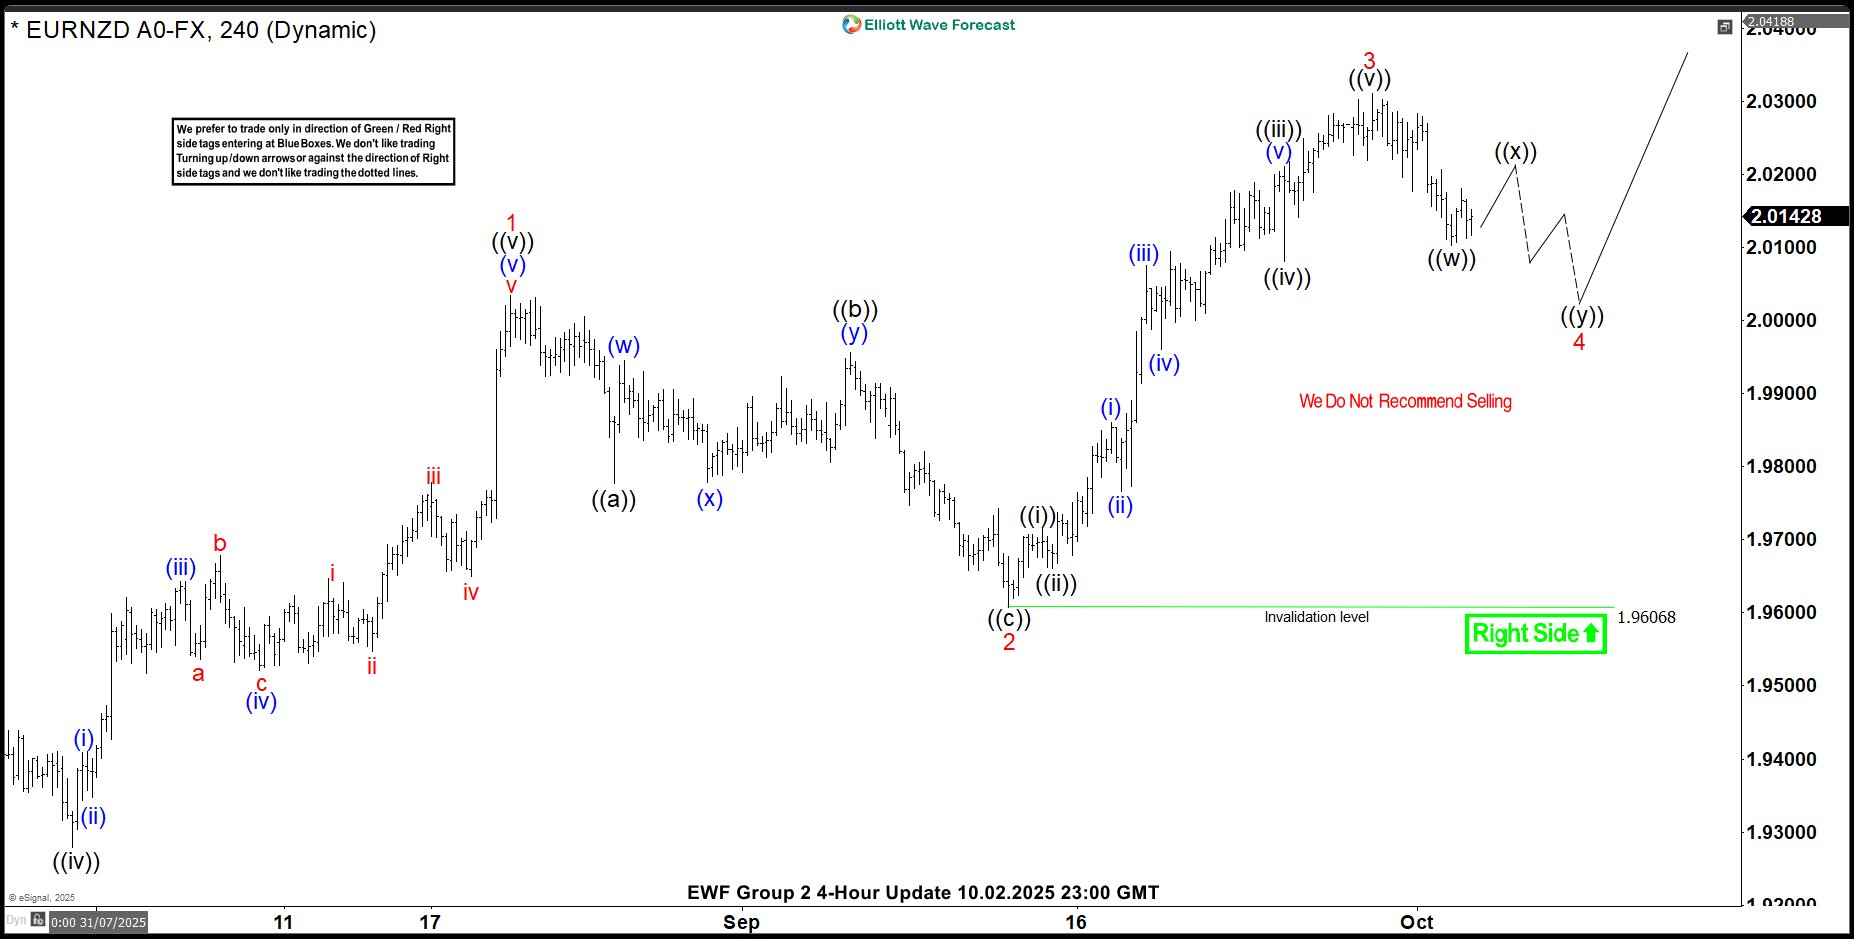
The EURNZD H4 chart above shows waves 1, 2, 3, and 4 of wave (A). Admittedly, this count could be interpreted in two or three different ways. However, every trader can agree on one thing — the pair is in a clear impulsive sequence. Since the February 2009 cycle has not yet reached its extreme, traders can still look for long opportunities from the extremes of a 3, 7, or 11-swing pullback. Moreover, selling such a strong bullish market is not ideal.
Therefore, the ongoing pullback in wave 4 could provide another excellent buying opportunity, especially near the extreme of a possible 7-swing structure. We will continue to monitor this setup and mark the blue box area, where buyers can look to enter with defined stops.
Members know the blue box highlights the high-probability buy zone and the ideal area to place protective stops.
Source: https://elliottwave-forecast.com/forex/eurnzd-elliott-wave-bullish-setup/