
Brent Crude Oil (BZ) is a major global benchmark for crude oil pricing, primarily sourced from the North Sea between the United Kingdom and Norway. It is a light, sweet crude oil, characterized by a low sulfur content (sweet) and low density (light), making it ideal for refining into gasoline and diesel. Brent Crude is traded on the Intercontinental Exchange (ICE) under the ticker symbol “BZ” and serves as a reference price for approximately two-thirds of the world’s internationally traded oil supplies. In this article, we will look at the Elliott Wave outlook for Brent Crude and when to anticipate the pullback is complete.
Brent Crude Weekly Elliott Wave Chart
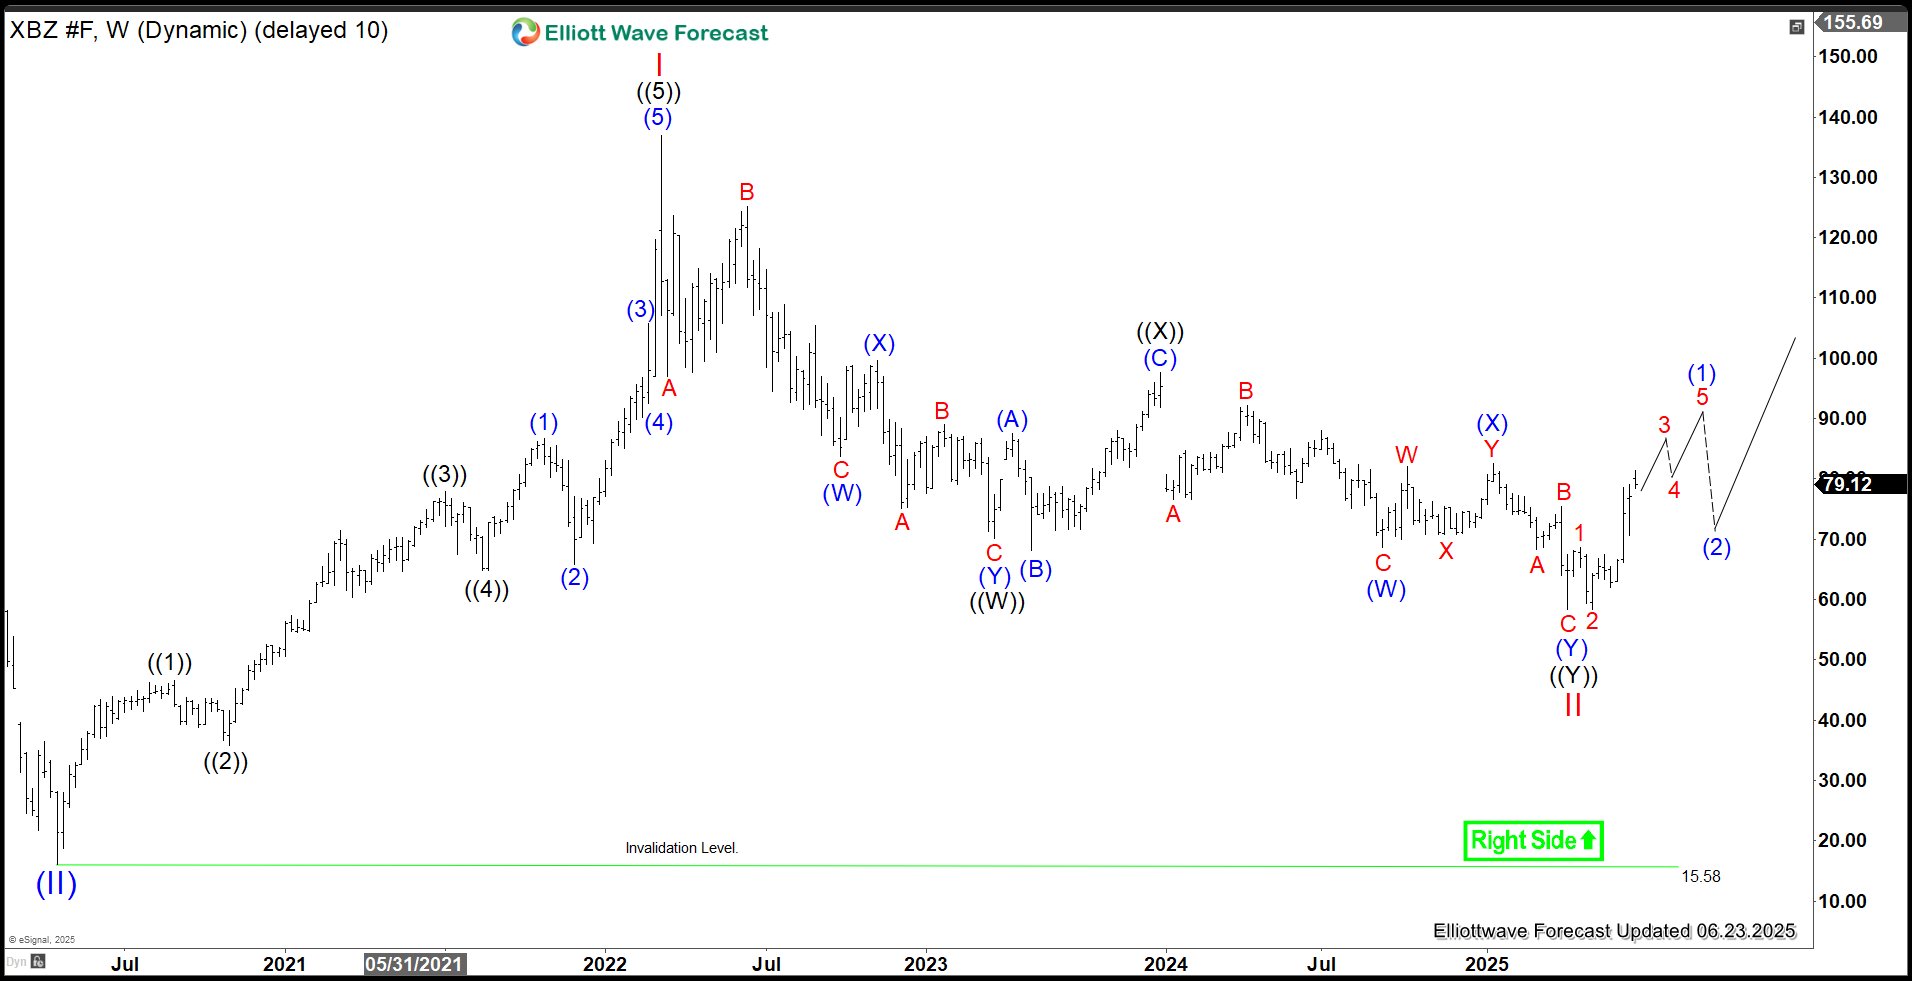
The weekly Elliott Wave Chart for Brent Crude indicates a Super Cycle wave (II) low of $15.74 in April 2020 during the COVID-19 selloff. Since then, it has rallied, completing wave I at $137 in March 2022. The wave II pullback concluded on April 9, 2025, at $58.39, with the instrument now advancing in wave III. Anticipate pullbacks to attract buyers at the 3, 7, and 11 swing levels, supporting further upside in the coming months and years.
Brent Crude Daily Elliott Wave Chart
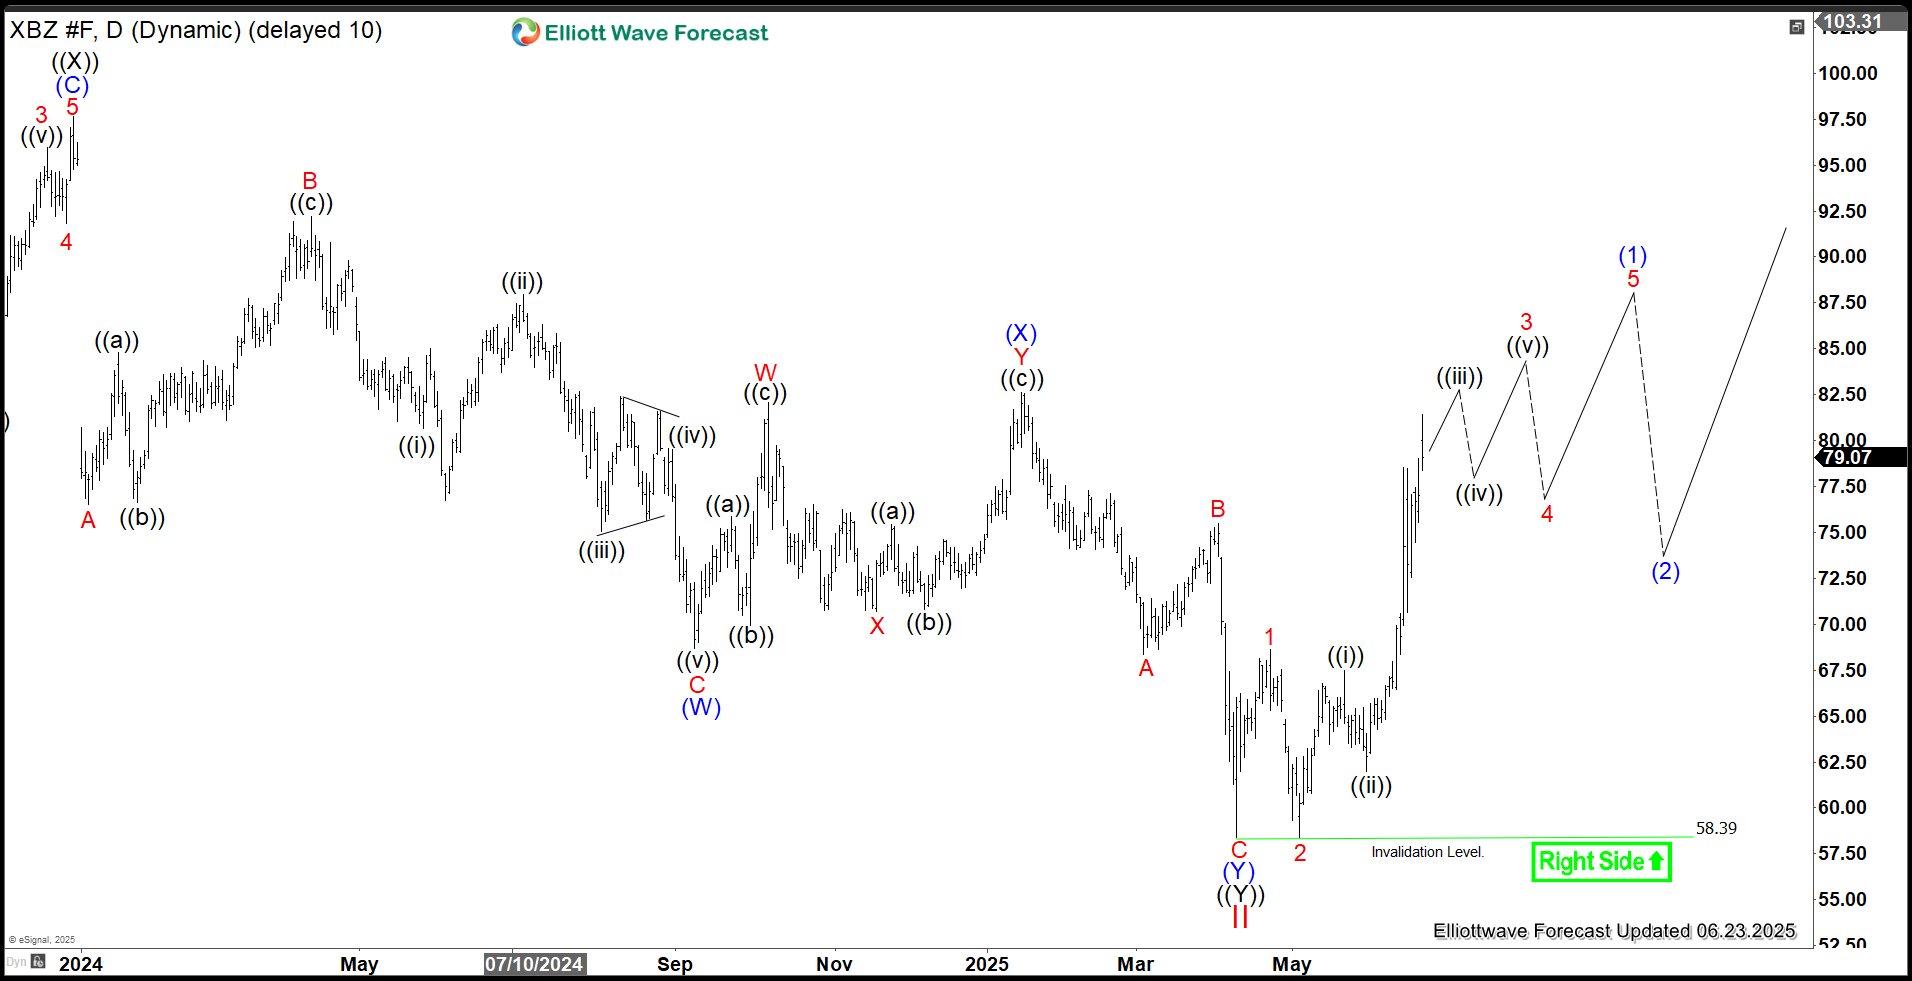
The Daily Chart of Brent Crude Oil illustrates a decline from the wave I peak, unfolding as a double-three Elliott Wave structure. From wave I, wave ((W)) concluded at $70.13, followed by a wave ((X)) rally ending at $97.63 as an expanded flat. The instrument then resumed its decline in wave ((Y)), reaching $58.39, completing wave II in Cycle Degree on April 9, 2025. Brent Crude has since rallied with an impulsive internal subdivision, confirming the low is in place and signaling the start of a new bullish cycle.