
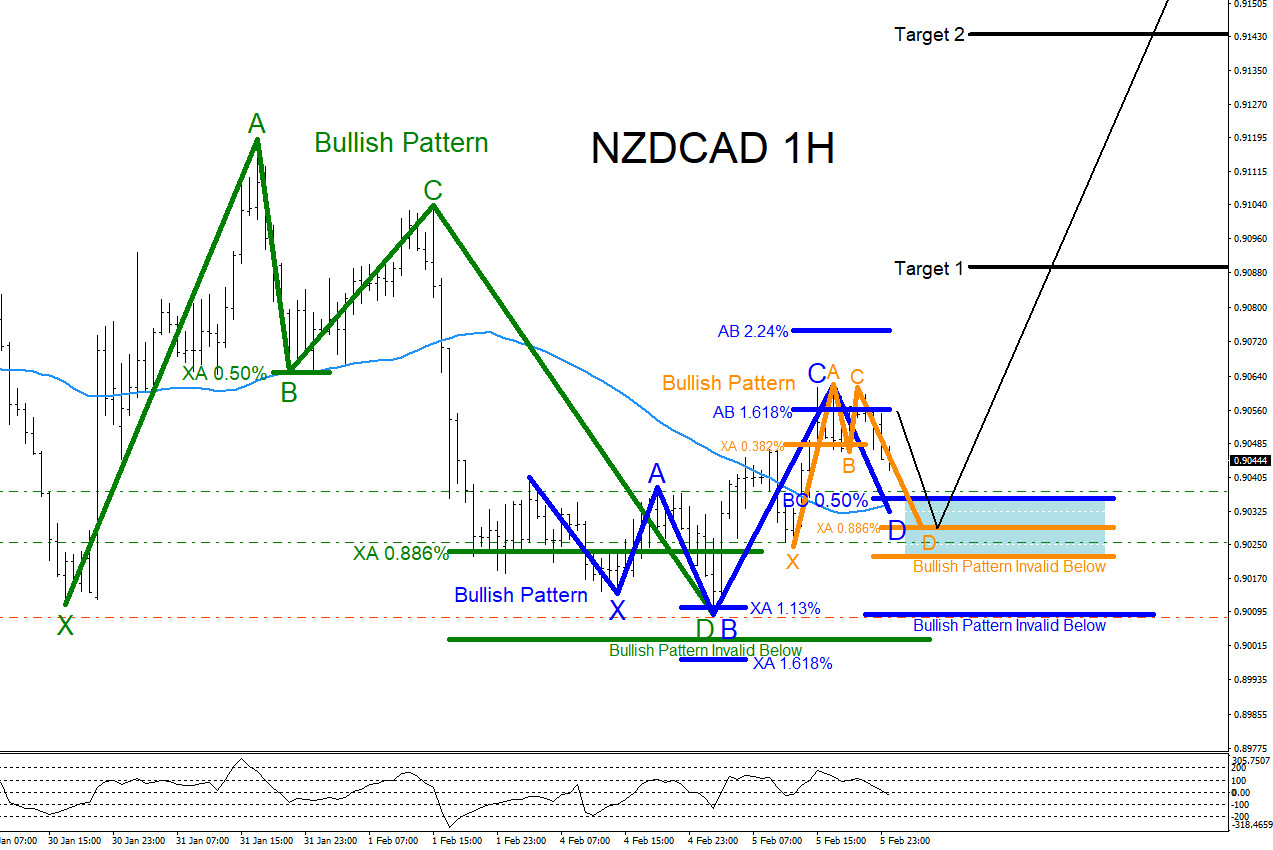
NZDCAD remains bullish as long as today’s low (0.9008) remains untouched. On the 1 hour chart there are clear visible bullish patterns that can be seen. In the chart below, market patterns are used to determine where price can possibly pause and reverse higher. The green bullish pattern has already triggered BUYS at the XA 0.886% Fib. retracement level. The green bullish pattern point D terminated slightly below the XA 0.886% level but did not extend below the invalidation level and has since bounced higher. Traders should now watch the possible blue and orange bullish patterns that trigger BUYS on a dip lower from current price. Blue bullish pattern triggers BUYS at the BC 0.50% Fib. retracement level and if price extends a little lower the orange bullish pattern will trigger BUYS at the XA 0.886% Fib. retracement level. Traders need to wait and watch how price reacts at the possible support zone (blue box) and see if the market reacts higher to any of these bullish patterns. If looking to trade NZDCAD stops should be placed at the point B low of the blue bullish pattern looking for a rally higher to extend higher and hit targets above. Only time will tell what NZDCAD will do but at least now you are aware of the possible area where the pair can bounce from.
NZDCAD 1 Hour Chart 2.5.2019
Of course, like any strategy/technique, there will be times when the strategy/technique fails so proper money/risk management should always be used on every trade. Hope you enjoyed this article.
*** Always use proper risk/money management according to your account size ***