
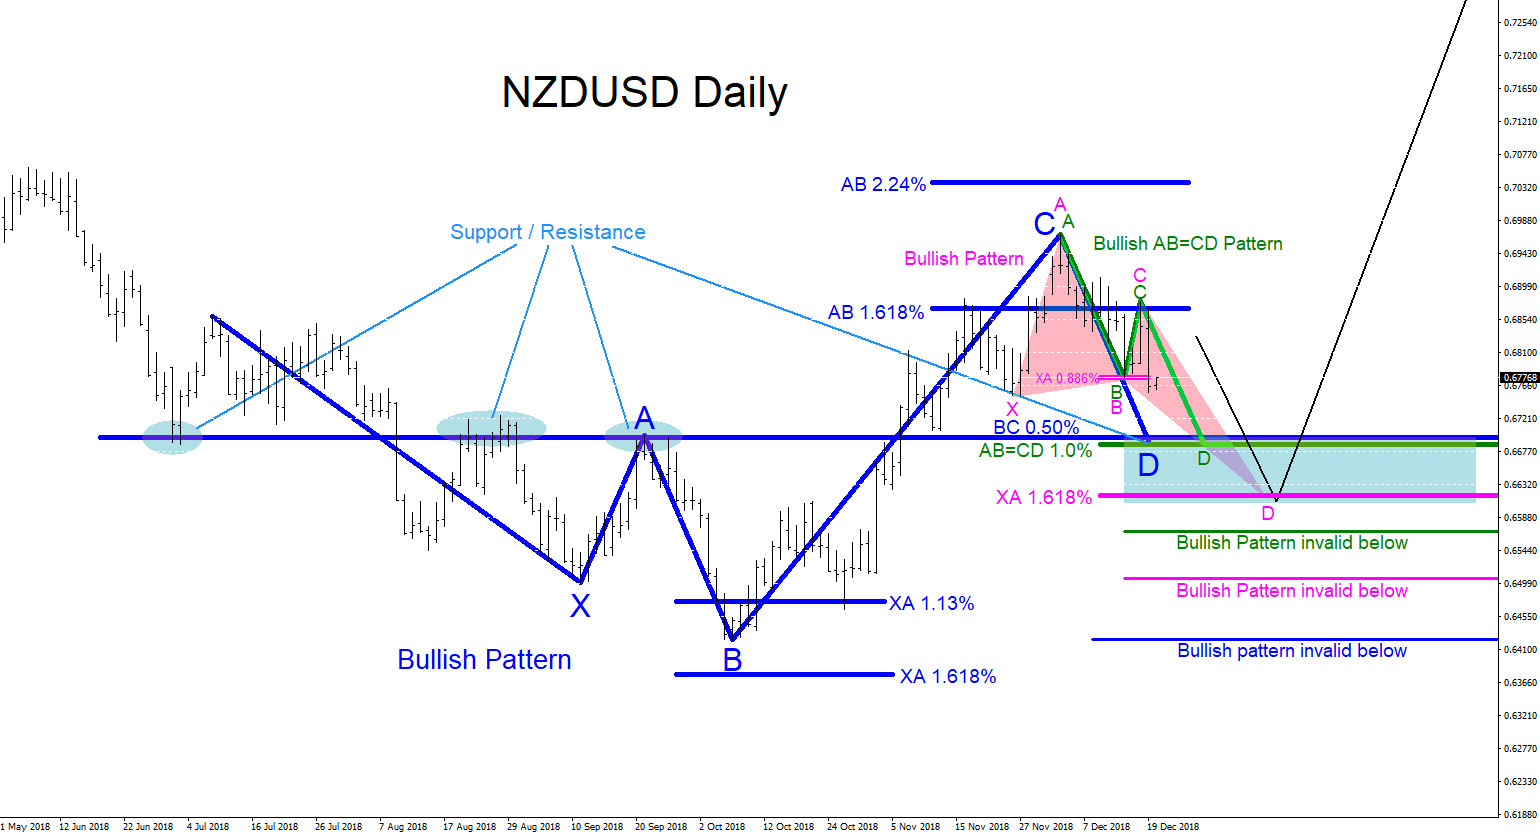
NZDUSD remains bullish as long as the October 8/2018 low remains untouched. On the Daily chart there are clear visible bullish patterns that can be seen. In the chart below, market patterns are used to determine where price can possibly pause and bounce higher. The green bullish AB=CD pattern triggers BUYS at the Fib. extension 1.0% level. The green AB=CD pattern is also close to where the blue bullish pattern triggers BUYS which is at the BC 0.50% Fib. retracement level. Traders should watch these two levels for a possible reaction bounce higher because there has been previous support/resistance price action in the past. Another bullish pattern can also possibly form if price continues lower towards the pink XA 1.618% Fib. retracement level where the pink bullish pattern triggers BUYS. Traders will need to wait and watch how price reacts at the possible support zone (blue box) and see if the market reacts higher to any of these bullish patterns. If looking to trade NZDUSD stops should be placed at the point B low of the blue bullish pattern looking for a rally higher to extend above the December 4/2018 highs. Only time will tell what NZDUSD will do but at least now you are aware of the possible area where Kiwi can bounce from.
NZDUSD Daily Chart 12.19.2018
Of course, like any strategy/technique, there will be times when the strategy/technique fails so proper money/risk management should always be used on every trade.