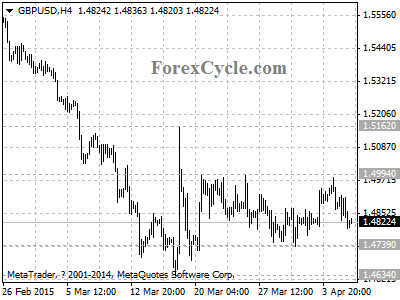
GBPUSD moved sideways in a trading range between 1.4739 and 1.4994. Resistance is at 1.4994, a break of this level will signal resumption of the uptrend from 1.4634, then further rise to 1.5200 area could be seen. Support is at 1.4739, below this level will indicate that the long term downtrend from 1.7190 (Jul 15, 2014 high) has resumed, then the following downward movement could bring price to 1.4000 area.