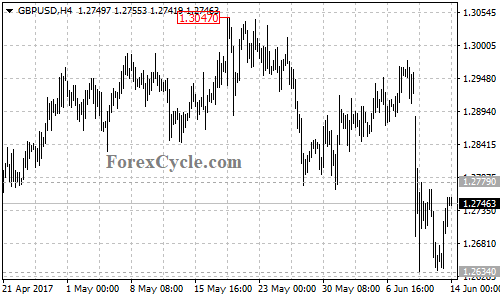
GBPUSD formed a sideways movement in a trading range between 1.2634 and 1.2779 on its 4-hour chart. As long as the pair is below 1.2779 resistance, the price action in the range could be treated as consolidation of the downtrend from 1.3047, and another fall towards 1.2500 could be expected after the consolidation. On the upside, a break through 1.2779 level could take price to the next resistance level at 1.2850, only break above this level could signal completion of the downtrend.