
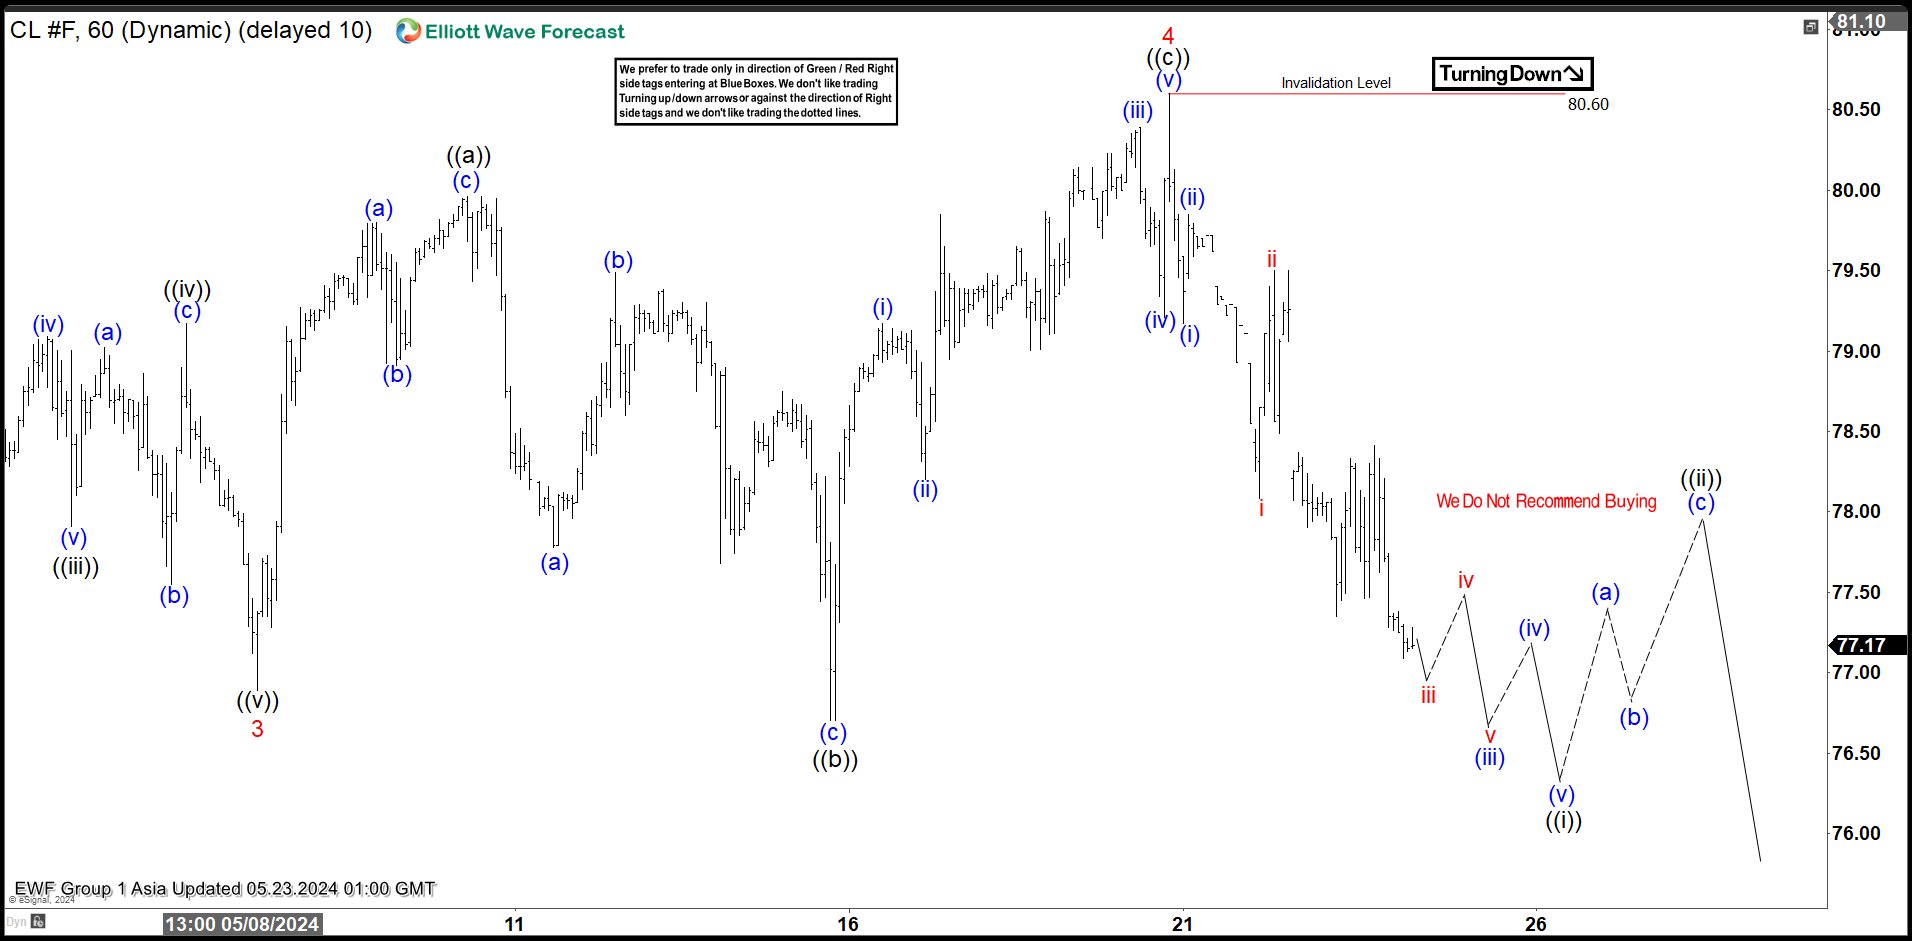
Short Term Elliott Wave in Light Crude Oil (CL) suggests the decline from 4.12.2024 high is in progress as a 5 waves impulse. Down from 4.12.2024 high, wave 1 ended at 81.56 and wave 2 rally ended at 86.28. Wave 3 lower ended at 76.89. The 1 hour chart below shows the starting point from wave 3. Wave 4 bounce unfolded as an expanded Flat structure. Up from wave 3, wave ((a)) ended at 79.96 and wave ((b)) ended at 76.70. Wave ((c)) higher ended at 80.6 which completed wave 4 in higher degree.
Oil has turned lower in wave 5. Down from wave 4, wave (i) ended at 79.17 and wave (ii) ended at 79.85. Down from there, wave i ended at 78.08 and wave ii ended at 79.5. Expect wave iii to end soon, then it should see 2 more lows to end wave (v) of ((i)). Afterwards, it should rally in wave ((ii)) to correct cycle from 5.20.2024 high in 3, 7, or 11 swing before it resumes lower again. Near term, as far as pivot at 80.6 high stays intact, expect rally to fail in 3, 7, or 11 swing for further downside.
Oil (CL) 60 Minutes Elliott Wave Chart
Source: https://elliottwave-forecast.com/news/elliott-wave-analysis-oil-cl-looks-short-term-weakness/